
Tags
Financial Systemic Issues: Booms and Busts - Central Banking and Money - Corporate Governance - Cryptocurrencies - Government and Bureaucracy - Inflation - Long-term Economics - Risk and Uncertainty - Retirement Finance
Financial Markets: Banking - Banking Politics - Housing Finance - Municipal Finance - Sovereign Debt - Student Loans
Categories
Blogs - Books - Op-eds - Letters to the editor - Policy papers and research - Testimony to Congress - Podcasts - Event videos - Media quotes - Poetry
Detroit and Puerto Rico: Which is the worse insolvency?
Published in Real Clear Markets.
Over four decades beginning in the 1970s, the U.S. financial system had one big municipal debt crisis per decade. These were New York City in the 1970s, the Washington Public Power Supply System (“Whoops!”) in the 1980s, Orange County, California in the 1990s, and Jefferson County, Alabama in the 2000s.
But our current decade, not yet over, has already set two consecutive all-time records for the largest municipal insolvencies in history: first the City of Detroit, which entered bankruptcy in 2013, and then Puerto Rico, which is now in an equivalent of bankruptcy especially created for it by Congress (under Title III of the PROMESA Act of 2016).
Between bonds, unfunded pensions, and other claims, Detroit’s record-setting debt upon bankruptcy was $18.8 billion. Puerto Rico has far surpassed that. Its comparable debt is $122 billion, or 6.5 times that of Detroit, with $74 billion in bonds and $48 billion in unfunded pensions.
On the other hand, Puerto Rico is five times bigger than Detroit, with a population of 3.4 million, compared to 687,000. We need to look at the problems on a per capita basis.
The result is not optimistic for the creditors of Puerto Rico. As shown below, Puerto Rico’s debt per capita is much bigger—33% higher– than Detroit’s was in 2013: about $35,800 versus $26,900.
Total debt Population Debt per capita
Puerto Rico $122 billion 3,411,000 $35,800
Detroit $ 18.8 billion 687,000 $27,400
On top of more debt, Puerto Rico has much less income per capita—23% less—than Detroit did. So as it arrives in court for a reorganization of its debts, its ratio of debt per capita to income per capita is 3.1 times, compared to 1.8 times for Detroit. As shown below, this is 70% greater relative debt—or alternately stated, Puerto Rico’s per capita income to debt ratio is only 59% of Detroit’s.
Puerto Rico Detroit PR/ Detroit Detroit/ PR
Total debt per capita $35,800 $27,400 131% 77%
Income per capita $11,400 $14,900 77% 131%
Per capita debt / income 3.14x 1.84x 170% 59%
Puerto Rico’s unemployment rate is very high at over 12%. This not as huge as Detroit’s 22%, but Puerto Rico’s abysmal labor participation rate of 40%, compared to Detroit’s already low 53%, offsets this difference. This leaves Puerto Rico with proportionally even fewer earners with lower incomes to pay the taxes to pay the much higher debt.
On a macro basis, then, it appears that the creditors of Puerto Rico can expect to do even more poorly than those of Detroit. How poorly was that?
At its exit from a year and a half of bankruptcy, Detroit’s total debt had been reduced to $10.1 billion. Overall, this was 53 cents on the dollar, or a loss of 47% from face value, on average. However, various classes of creditors came out very differently. Owners of revenue bonds on self-supporting essential services came out whole on their $6.4 billion in debt. If we exclude this $6.4 billion, leaving $12.4 billion in claims by everybody else, the others all together got $3.7 billion, or a recovery of 30 cents on the dollar, or a loss of 70%, on average.
Recoveries in this group ranged from 82 cents on the dollar for public employee pensions, to 74 cents for the most senior general obligation bonds, to 44 cents on more junior bonds, to 25 cents for settling swap liabilities, to 13 cents on certificates of participation, to 10 cents on non-pension post-retirement benefits and other liabilities. It is noteworthy that the public employee pensions did take a meaningful haircut, although they came out far better than most others. The pension settlement also included special funds contributed by the State of Michigan and special funds contributed by charitable foundations to protect the art collection of the Detroit Institute of Arts. These latter factors will not be present in the Puerto Rico settlement.
As a macro estimate, if we take as a baseline Detroit’s average settlement of 53 cents on the dollar and multiply it by Puerto Rico’s 59% of Detroit’s ratio of per capita income to debt, we get a guess of 31 cents on average for all the creditors. This is not extremely different from the official fiscal plan approved by the Puerto Rico Oversight Board, which estimates cash available for debt service of about 24% of the contractual debt service over the next ten years.
What will happen in the debt reorganization bargains, what role pension debt will play, how various classes of creditors will fare with respect to each other, what political actions there may be—all is up in the air as the court begins its work.
The lenders and borrowers responsible for the huge financial mistakes which led to deep insolvency need to seriously think through, as in every debt disaster, “How did we get ourselves into this mess?!” They are a long way from getting out of it.
The Fed must be held accountable and the CHOICE Act will make it so
Published in The Hill.
This week, the House Financial Services Committee passed Chairman Jeb Hensarling’s Financial CHOICE Act. Most of the public discussion of this bill is about its changes in banking regulations, but from a constitutional point of view, even more important are the sections that deal with the accountability of regulatory agencies and the governance of the administrative state.
Accountability is a central concept in every part of the government. To whom are regulatory agencies accountable? Who is or should be their boss? To whom is the Federal Reserve, a special kind of agency, accountable? Who is or should be its boss? To whom should the Consumer Financial Protection Bureau (CFPB) be accountable? Who should be its boss?
The correct answer to these questions, and the answer given by the CHOICE Act, is the Congress. Upon reflection, we should all agree on that. All these agencies of government, populated by unelected employees with their own ideologies, agendas, and will to power — as vividly demonstrated by the CFPB — must be accountable to the elected representatives of the people, who created them, can dissolve them, and have to govern them in the meantime. All have to be part of the separation of powers and the system of checks and balances that is at the heart of our constitutional order.
But accountability does not happen automatically: Congress has to assert itself to carry out its own duty for governance of the many agencies it has created and its obligation to ensure that checks and balances actually operate.
The theme of the Dodd-Frank Act was the opposite: to expand and set loose regulatory bureaucracy in every way its drafters could think of. It should be called the Faith in Bureaucracy Act.
In the CHOICE Act, Congress is asserting itself at last to clarify that regulatory agencies are derivative bodies accountable to the Congress, that they cannot be sovereign fiefdoms — not even the Dictatorship of the CFPB, and not even the money-printing activities of the Federal Reserve.
The most classic and still most important power of the legislature is the power of the purse. The CHOICE Act accordingly puts all the regulatory agencies, including the regulatory part of the Federal Reserve, under the democratic discipline of Congressional appropriations.
This notably would end the anti-constitutional direct grab from public funds which was originally granted to the CFPB — which was designed precisely to evade the democratic power of the purse. It is sometimes objected that appropriations “inject politics” into these decisions. Well, of course! Democracy is political. Expansions of regulatory power are political, all pretense of technocracy notwithstanding.
The CHOICE Act also requires of all financial regulatory agencies the core discipline of cost-benefit analysis. It provides that actions whose costs exceed their benefits should not be undertaken without special justification. That’s pretty logical and hard to argue with. Naturally, assessing the future costs and benefits of any action is subject to uncertainties — perhaps very large uncertainties. But this is no reason to avoid the analysis — indeed, forthrightly confronting the uncertainties is essential.
The CHOICE Act also requires an analysis after five years of how regulations actually turned out in terms of costs and benefits. This would reasonably lead — we should all hope it will — to scrapping the ones that didn’t work.
Further Congressional governance of regulatory agencies is provided by the requirement that Congress approve major regulatory rules — those having an economic effect of $100 million or more. Congress would further have the authority to disapprove minor rules if it chooses by joint resolution. This is a very effective way of reminding everybody involved, including the Congress itself, who actually is the boss and who has the final responsibility.
On the Federal Reserve in particular, the CHOICE Act devotes a title to “Fed Oversight Reform and Modernization,” which includes improving its accountability.
“Obviously, the Congress which set us up has the authority and should review our actions at any time they want to, and in any way they want to,” once succinctly testified a president of the New York Fed. Under the CHOICE Act, such reviews would happen at least quarterly.
In these reviews, I recommend that the Federal Reserve should in addition be required to produce a Savers Impact Statement, quantifying and discussing the effects of its monetary policies on savings and savers.
The CHOICE Act requires of new regulatory rules that they provide “an assessment of how the burden imposed … will be distributed among market participants.” This good idea should by analogy be applied to burdens imposed on savers by monetary actions.
By my estimate, the Federal Reserve has taken since 2008 over $2 trillion from savers and given it to borrowers. The Federal Reserve may want to defend its sacrifice of the savers as a necessary evil — but it ought to openly and clearly quantify the effects and discuss the economic and social implications with the Congress.
In sum, the CHOICE Act represents major improvements in the accountability of government agencies to the Congress and ultimately to the people. These are very significant steps forward in the governance of the administrative state to bring it under better constitutional control.
Data transparency and multiple perspectives
Published in Data Coalition.
One question underlying the very interesting data project and proposed legislation we are considering today is the relationship of data transparency to multiple perspectives on financial reality. In a minute, we will take up the question: Of all the possible views of a statue, which is the true view?
But first, let me say what a pleasure it is to participate in these discussions of financial transparency; the new Financial Transparency Act, a bill introduced in Congress last night; data standardization; and of course, greater efficiency— we are all for making reporting and compliance less costly.
Let me add to this list the separation of data and analysis, or what we may call the multiplication of perspectives on the financial object. The potential separation of data and analysis may allow a richer and more varied analysis and deeper understanding, in addition to greater efficiency, in both government and business.
As the new white paper “Standard Business Reporting,” by the Data Foundation and PricewaterhouseCoopers, says: “By eliminating documents and PDFs from their intake, and replacing document-based reporting with open data…agencies…gained the ability to deploy analytics without any translation.” Further, that standardized data “will allow individuals to focus on analytics and spend time understanding the data.”
In historical contrast to these ideas, it is easy for me to remember when we couldn’t do anything like that. When I was a young international banking officer working in Germany, one day—4,000 miles to the west, back in the Chicago headquarters—the head of the international banking department had lunch with the chairman of the board. Picture the chairman’s elegant private dining room, with china, silver and obsequious service. In the course of the lunch, the chairman asked: “For our large customers, can we see in one place all the credit exposure we have to them in different places around the world?” Said the executive vice president of international banking: “Of course we can!”
The next day, all over the world, junior people like me were busy with yellow pads and calculators, wildly working to add up all the credit exposure grouped into corporate families, so those papers could be sent to somebody else to aggregate further until ultimately they all were added up for the chairman.
That was definitely not data independent of documents. Imagine the high probability, or rather the certainty, of error in all those manually prepared pages.
A classic problem in the philosophical theory of knowledge turns out to be highly relevant to the issues of data transparency. It is the difference between the real object, the “thing in itself,” and any particular representation or perspective on it. In philosophical terms, the object is different from any particular perspective on it, but we can only perceive it or think about it or analyze it from particular perspectives.
Likewise, a reporting document is a composite of the data—the thing—and some theory or perspective on the data which form the questions the report is designed to pursue and answer.
Let’s consider a famous type of report: GAAP financial statements.
Somewhere far underneath all the high-level abstractions, reflecting many accounting theories, are the debits and credits, myriad of them doing a complex dance.
I think of my old, practical-minded instructor in Accounting 101. This essential subject I studied in night school when I was a trainee in the bank. I would ride the Chicago “L” train to my class, my feet freezing from the cold draft blowing under the doors. But this lesson got burned into my mind: “If you don’t know what to debit and what to credit,” he said, “then you don’t understand the transaction from an accounting point of view.” This has always seemed to me exactly right.
Later on, in this spirit, I used to enjoy saying to accountants advising me on some accounting theory: “Just tell me what you are going to debit and what you are going to credit.” This usually surprised them!
I wonder how many of us here could even begin to pass my old accounting instructor’s test when considering, say, the consolidated financial statements of JPMorgan. What would you debit and credit to produce those? Of course we don’t know.
For JPMorgan, and everybody else, the debits and credits are turned into financial statements by a very large set of elaborate theories and imposed perspectives. These are mandated by thousands of pages of Financial Accounting Standards pronounced by the Financial Accounting Standards Board. Many of these binding interpretations are highly debatable and subject to strongly held, inconsistent views among equally knowledgeable experts.
Any large regulatory report has the same character: it is a compound of data and theory.
An articulate recent letter to the editor of the Wall Street Journal argues that: “The CPA profession has made the accounting rules so convoluted that GAAP financials no longer tell you whether the company actually made money.” This, the letter continues, is “why companies are increasingly reporting non-GAAP. Investors are demanding this information. …Why should public companies not supply shareholders with the same metrics that the management uses?” Why not, indeed?
In other words, why not have multiple interpretative perspectives on the same data, instead of only one? This is a fine example of the difference between one perspective—GAAP—and other possibly insightful perspectives on the same financial object. Why not have as many perspectives readily available as prove to be useful?
We are meeting today in Washington, D.C., a city full of equestrian statues of winning Civil War generals. (The losing side is naturally not represented.) Think, for example, of the statues of General Grant or Sheridan or Sherman or Logan—all astride their steeds. Perhaps you can picture these heroic statues in imagination.
I like to ask people to consider this question: What is the true view of a statue? Is it the one from the front, the top, the side (which side?), or what? Every view is a true view, but each is partial. Even the view of such an equestrian statue directly from behind—featuring the horse’s derriere—is one true view among others. It is not the most attractive one, perhaps, but it may make you think of some people you know.
Likewise, what is the true view of a company, a bank, a government agency, a regulated activity or a customer relationship? Every document is one view.
Pondering this brings back a memory of my professor of 19th century German philosophy. “The object,” he proposed, “is the sum of all possible perspectives on it.”
Similarly, we may say that a financial structure or a policy problem or an entity or an activity is the sum of many perspectives on it. The ideal of open data available for multiple reports, analyses and purposes is a practical application of this metaphysical idea.
The ideal is not new. In 1975, I went to London to work on a project to define all the elements—what were supposed to become the standardized data—for characterizing all the bank’s corporate customer relationships. The computing technology expert leading the project convincingly explained how these data elements could then be combined and reordered into all the reports and analyses we would desire.
Then, as now, it was a great idea—but then it never actually happened. It was before its time in technical demands. But now I suspect the time has really come. Fortunately, since then, we have had four decades of Moore’s Law operating, so that our information capacities are more than astronomically expanded.
So:
By freeing transparent, open data from being held captive in the dictated perspectives of thousands of reporting documents;
By saving data from being lost in the muddle of mutually inconsistent documents;
Can we provide transparent data, consistently defined, which will promote a wide variety of multiple perspectives to enrich our analysis and create new insights;
Not to mention making the process a lot cheaper?
This would be a great outcome of the project under consideration in our discussions today.
FSOC is too political to be taken seriously
Published in American Banker.
The Financial Stability Oversight Council is a political body masquerading as an analytical one. A dubious creation of the Dodd-Frank Act, it reflects that law’s urge to expand the power of bureaucrats, in turn reflecting the implausible credo that they can control “systemic risk” because they know the financial future better than other people. They don’t.
The expected result of a committee of heads of federal agencies chaired by the Treasury secretary is a politicized process. This was undoubtedly the case with the council’s attempt to designate MetLife as a “systemically important financial institution.” It should not be surprising that a U.S. District Court judge threw out the designation, ruling that it was “arbitrary and capricious,” and “hardly adhered to any standard when it came to assessing MetLife’s threat to financial stability.” In dissenting from the council’s action on MetLife, S. Roy Woodall — the FSOC’s statutorily required independent member with insurance expertise — said the designation relied on “implausible, contrived scenarios.”
Decisions concerning “systemic risk,” an unclear term in any case, cannot be purely analytical and objective. They involve generalized and debatable theories. They are, to a significant extent, inherently judgmental, subjective and political. The FSOC effectively sits as a miniature, unelected legislature. That is a bad idea.
The fundamental problem is the structure of the FSOC as designed by Dodd-Frank. To begin with, it is chaired by the Treasury secretary, a senior Cabinet member who always has major partisan interests at stake. No company can be considered for SIFI status without the Treasury secretary’s approval. This means that, by definition, the FSOC’s work is not a disinterested, analytical process. An administration is positioned to pick winners and losers. Under the Obama administration, MetLife was in the crosshairs, but Fannie Mae, Freddie Mac and Berkshire Hathaway were off-limits.
Meanwhile, most other FSOC members are heads of independent regulatory agencies, strongly motivated by bureaucratic self-interest to defend their jurisdictional turf from intrusions by the others, and to defend their regulatory records from criticism.
This conflicts with the ostensible purpose of the FSOC: to provide the combined substantive deliberation and development of insights into evolving risks from a diverse group of officials. The expectation that that purpose could be achieved was naive. When I asked one former senior FSOC official from the Obama administration if the meetings of the FSOC members had ever provided a new insight, he gave me a candid answer: No. One can hypothesize that the authors of Dodd-Frank were in fact not naive — that they welcomed another way to expand the reach of the administrative state.
The FSOC’s decision-making authority grants significant regulatory power to Treasury, as well as to members who help decide which firms are SIFIs and which are not. But that’s only the beginning, since the designation process also grants enormous power to the Federal Reserve. If an insurance company becomes designated by the FSOC, it falls under the Fed’s supervisory authority, even though the Fed has little or no experience in insurance regulation. Every head of the central bank who participates in FSOC designations is an interested and conflicted party in discussions that result in expanding the Fed’s authority. The politicization also leads the FSOC to ignore companies that more objectively deserve the SIFI label. The most egregious case of this, of course, is the council’s utter failure to address Fannie Mae and Freddie Mac, which are without question very systemically risky. On top of being huge, they are incarnations of these systemic risk factors: highly leveraged real estate and the moral hazard created by government guarantees.
Dodd-Frank assigns the FSOC the task of “eliminating expectations on the part of shareholders, creditors and counterparties that the Government will shield them from losses.” But Fannie and Freddie are pure cases of the government shielding creditors and counterparties from losses. But the staff of the FSOC was ordered not to study them—a bankruptcy of the FSOC’s intellectual credibility.
It appears that the FSOC has so much baggage that the best approach is simply to scrap it. If a truly independent, analytical systemic risk regulator is desired, it should be created outside of the Treasury’s political control.
U.S. banks’ real estate boom could be signaling next crisis
Published in Inside Sources.
Excessive real estate credit is the most common cause of banking booms, busts and collapses, throughout history, right up through the most recent financial crisis and around the world.
The U.S. commercial banking system has gotten much bigger relative to the U.S. economy than it used to be, although there are many fewer banks. The principal source of this growth is that banks have vastly increased their real estate exposure relative to the U.S. economy as a whole. This acceleration in real estate risk has fundamentally changed the nature of the banking system and its systemic risk.
Looking back to 1960, there were in the United States: 13,126 commercial banks and 18,962 depository institutions. By the end of 2016, depositories totaled only 5,913, of which 5,113 were commercial banks. That’s a 69 percent reduction in the number of depository institutions, and a 61 percent reduction in commercial banks.
On the other hand, in 1960, the total assets of the commercial banking system were only $256 billion. Though hard to believe, the entire banking system had total assets of only about one-tenth of today’s JPMorgan-Chase, and only 1.6 percent of today’s banking assets of $15.6 trillion. Citibank — which wasn’t Citibank then, but the dignified First National City Bank of New York — had less than $9 billion in assets. To our minds, now muddled by decades of constant inflation — including a central bank that has formally committed itself to creating perpetual inflation — these all seem like very small numbers.
Instead of measuring in nominal dollars, to see through the fog of long years of inflation, we can measure banking assets consistently relative to the size of the economy, as a percent of annual gross domestic product. The $256 billion of commercial banking assets in 1960 was 47 percent of the $541 billion in GDP.
The increase is striking: by 2016, banking assets had gone from 47 percent to 83 percent of GDP. That is more than a 75 percent increase in the banking system’s size relative to the economy, at the same time the number of banks fell by more than 60 percent. At present, this ratio is close to its all-time bubble peak.
What is driving this growth? It’s not commercial and industrial loans. On the trend, their percent of GDP is flat at 8 percent to 10 percent since 1960. On average, the commercial and industrial loans of the banking system have kept up with the growth of the economy, but not more.
The real driving factor is real estate credit. The commercial banking system’s real estate loans rose relentlessly from 5 percent of GDP in 1960, to more than 26 percent at their bubble peak, and are now at 22.5 percent.
Nor is this the whole real estate story. With the popularization of mortgage securitization, the banking system’s securities portfolio, not only its loan portfolio, shifted to real estate risk. Going back to 1992, the sum of banks’ real estate loans and mortgage-backed securities as a percent of GDP has risen to 32 percent — six times the 1960 level.
In short, the vast bulk of the dramatic increase in the size of the banking system relative to the economy comes from the acceleration of real estate exposure — a rising trend for more than six decades. How can the banks keep doing this? Well, it helps to have your liabilities guaranteed by the government, both explicitly through deposit insurance and implicitly through bailouts and central banking.
Should the banking system keep getting bigger relative to the economy, and should this increase continue overwhelmingly to reflect real estate risk? That is a dubious proposition. As Columbia University’s Charles Calomiris has written (in a not-yet-published paper): “The unprecedented pandemic of financial system collapses over the last four decades around the world is largely a story of real estate booms and busts. Real estate is central to systemic risk.”
Very true. But as Calomiris notes, the Financial Stability Oversight Board, set up as part of the Dodd-Frank Act to oversee the U.S. financial system, “seems to be uninterested.”
The Bank Holding Company Act of 1956 defined a bank as an institution that accepts demand deposits and makes commercial loans. Neither part of this old definition still touches on the main point. A bank now is for the most part an institution that makes real estate loans and funds them with government-guaranteed liabilities.
This banking evolution poses a huge systemic question: How do you deal with a banking system whose risks are concentrated in real estate prices and leverage? To this question we are, as yet, without an answer. Do the supposed systemic thinkers at the Financial Stability Oversight Council even understand the magnitude of the historic shift in risk? Maybe a future FSOC with new members will do better.
What is the actual collateral for a mortgage loan?
Published in Real Clear Markets.
“Economics and finance are like going to the dog races,” my friend Desmond Lachman of the American Enterprise Institute is fond of saying. “Stand in the same place and the dogs will come around again.” So they will.
U.S. financial markets produced sequential bubbles – first in tech stocks in the 1990s and then in houses in the 2000s.
“What is the collateral for a home mortgage loan?” I like to ask audiences of mortgage lenders. Of course, they say, “the house,” so I am pleased to tell them that is the wrong answer. The correct answer is the price of the house. My next question is, “How much can a price change?” Ponder that. The correct answer is that prices, having no independent, objective existence, can change a lot more than you think. They can go up a lot more than you think probable, and they can go down a lot more than you think possible. And they can do first one and then the other.
This is notably displayed by the asset price behavior in both the tech stock and housing bubbles. As the dogs raced around again, they made a remarkably symmetrical round trip in prices.
Graph 1 shows the symmetrical round trip of the notorious “irrational exuberance” in dot-com equities, followed by unexuberance. It displays the NASDAQ stock index expressed in constant dollars.

Now consider houses. Graph 2 shows the Case-Shiller U.S. national house price index expressed in constant dollars. Quite a similar pattern of going up a lot and then going down as much.

The mortgage lending excesses essential to the housing bubble reflected, in part, a mania of politicians to drive up the U.S. homeownership rate. The pols discovered, so they thought, how to do this: make more bad loans—only they called them, “creative loans.” The homeownership rate did rise significantly—and then went back down to exactly where it was before. Another instructive symmetrical round trip, as shown in Graph 3.

The first symmetrical up and down played out in the course of three years, the second in 12 years, the third in two decades. Much longer patterns are possible. Graph 4 shows the amazing six-decade symmetry in U.S. long-term interest rates.

Is there magic or determinism in this symmetry? Well, perhaps the persistence of underlying fundamental trends and the regression to them shows through, as does the reminder of how very much prices can change. In the fourth graph, we also see the dangerous power of fiat currency-issuing central banks to drive prices to extremes.
Unfortunately, graphs of the past do not tell us what is coming next, no matter how many of them economists and analysts may draw. But they do usefully remind us of the frequent vanity of human hopes and political schemes.
The Federal Reserve is the bank most in need of a stress test
Published in Real Clear Markets.
Do you know a bank that is leveraged at more than 100:1-to be exact, with assets of 111 times its equity? You do: it’s the Federal Reserve.
The consolidated Federal Reserves banks had total assets of $4.47 trillion as of Dec. 14, 2016, compared to total capital of merely $40.4 billion, or less than 1 percent of assets-actually, 0.9 percent.
The largest Federal Reserve Bank by far, New York, sports $2.47 trillion in total assets and only $13 billion in total capital, for leverage of a pretty remarkable 190 times and a capital ratio of 0.53 percent.
The Fed enjoys imposing stress tests on everybody else. What if we give the Fed a stress test? The interest rate risk of the Fed is similar to a 1980s savings-and-loan – lots of long-term, fixed rate assets, with short funding. So let’s apply a simple and standard interest rate stress test. Suppose long-term interest rates rise by 2 percent, to a historically more normal level. What happens to the Fed?
Well, the Fed now owns $4.4 trillion of long-term, fixed-rate assets and unamortized premium paid. It does not disclose the duration of this massive position, but let’s say it’s five years (it could be longer). If interest rates rise by 2 percent, the market value loss to the Fed is approximately 5 times 2 percent or 10 percent of the $4.4 trillion position. That would be an economic loss of $440 billion. That is 11 times the Fed’s total capital.
It seems highly likely that the Federal Reserve System, and the Federal Reserve Bank of New York in particular, would then be hugely insolvent on a mark-to-market basis. Stress test score: F.
Defenders of the Fed confidently claim that it doesn’t matter if the Fed is insolvent. Maybe they are right. If they are, the Fed should have no hesitation at all in publishing the mark to market of its giant securities portfolio, the way the Swiss central bank is required to do. To the Fed Board of Governors: How about it?
Why current asset prices are dangerously exaggerated
Published in Real Clear Markets.
Over the long term, real per-capita household net worth in the United States has grown at about 2 percent a year. This is a wonderful achievement of the enterprising economy.
In shorter periods, when asset prices get inflated in a bubble, household per-capita wealth appears to rise notably above this long-term pace, but ultimately, bubble asset prices inevitably shrivel. When they do, many commentators claim that a lot of “wealth” been lost by households. It hasn’t, because the apparent wealth was not really there in the first place: it was an illusion of the bubble.
If any very great number of people try to sell out at the bubble prices, the evanescent “wealth” disappears, the bubble deflates and the long-term trend reasserts itself, so the aggregate bubble prices can never be realized. Bubble times reflect what Walter Bagehot so truly wrote in 1873: “All people are most credulous when they are most happy.”
Graph 1 is the record of 1953 to 2016. The temporary illusion of wealth represented by two remarkable bubbles of recent decades is obvious.

We should recall with amused irony that the central bankers formerly congratulated themselves for creating what they credulously called “The Great Moderation.” What they actually presided over was the Era of Great Bubbles: first the Great Overpaying for Tech Stocks in the 1990s, then the Great Overleveraging of Real Estate in the 2000s.
And now? They are congratulating themselves again for innovative or radical monetary actions, including their zero interest rate policy (ZIRP), which expropriates the returns to savers and makes the present values of assets rise. Many observers, including me, think they have by their manipulations inflated new bubbles in stocks, bonds and houses. This has put real household wealth per-capita measured at current asset prices back over its 2 percent growth line, although not as egregiously as in the government-promoted housing bubble of the last decade. We can expect ultimate regression to the trend, as always.
But has the trend shifted? From 1950 to 2000, growth in U.S. real per-capita gross domestic product averaged more than 2 percent per-year. This is consistent with a 2 percent growth in wealth per-capita. But since 2000, real per-capita GDP has grown less than 1 percent per-year. Suppose the stagflationists are right, and this represents not a temporary, but a sustained downshift. Then it would be consistent with real per-capita economic growth to move our trend growth in real net worth per-capita down to 1 percent. Graph 2 shows the possible new trend line, starting in 2000.

If we measure from this new line, the current ZIRP bubble looks much worse; it has reached almost the same magnitude as the infamous housing bubble of a decade ago.
Graph 3 shows the variation from the 2 percent and 1 percent lines, displaying the illusory household wealth effects of the series of bubbles in a different fashion.

The more you believe the stagflationist theory, the more you must conclude that current asset prices are dangerously exaggerated, the greater the bubble you must conclude that the central bank experiments have wrought and the further we have to fall back to the trend.
The Credit Crunch of 1966: An instructive 50th anniversary
Published in Real Clear Markets.
It’s the 50th anniversary of the Credit Crunch of 1966, which roiled financial markets in August and September of that year. Group financial memory fades, so if you don’t know or remember that there was such a crunch, searing at the time, you are not alone. Yet it taught an essential lesson, again being relearned right now, 50 years later: the Federal Reserve, and central banks in general, simply do not know what the right interest rate is.
Central to the events of 1966 was that the Federal Reserve set the maximum interest rates that banks could pay on their deposits. This was the Fed’s now long-gone but then critical “Regulation Q” authority, at the time considered an essential part of the banking system.
As of July 1966, the Fed had set the interest-rate ceiling on savings deposits at 4 percent. For so-called “multiple maturity” time deposits (where withdrawal was at the depositor’s notice) it was 4 percent for a minimum maturity of up to 89 days, and 5 percent for 90 days or more. For fixed-maturity date time deposits, the ceiling was 5.5 percent. In September 1966, it dropped to 5 percent, except that deposits of more than $100,000 (that’s $743,000 in 2016 dollars) could still get 5.5 percent.
How did the Fed know those numbers were right? It didn’t, as events demonstrated. Most of the time over the preceding decades, they had set the ceiling over market rates, so it generally hadn’t been an issue.
But in 1966, there was strong credit demand from an extended economic expansion, plus inflationary pressure from the Vietnam War and “Great Society” deficits. Interest rates in the open market went much higher than before. Three-month Treasury bill yields got to 5.59 percent, the federal funds rate to 5.77 percent and commercial paper rates to 6 percent. Market rates on negotiable CDs went over the ceilings. “The prime rate briefly reached the then unheard of level of 6 percent,” wrote economist Albert Wojnilower. A 6 percent prime rate was the highest it had been in more than 30 years.
This time, the Fed refused to raise the ceiling in line with the market, in part reflecting political pressure to limit competition for deposits in order to favor savings-and-loan institutions, which were stuck with long-term mortgages at low fixed rates. Lending long and borrowing short was already dangerous in 1966.
Naturally, in response, people took their money out of both banks and savings and loans and put it into higher-yielding conservative investments, a perfectly sensible thing to do. This process had a cumbersome name at the time: “disintermediation”—a problem created entirely by regulation. Unable to expand their funding, the banks cut back on their loans. The savings and loans cut way back on their mortgage loans. “For most people, residential mortgage money was unobtainable…there was a sharp slump in mortgage loans and housing starts,” wrote The New York Times.
Banks also cut back on their previously expanding investments, notably in municipal bonds. Both banks and thrifts worried about their ability to fund their existing balance sheets. As described by the theoretician of financial crises, Hyman Minsky: “By the end of August, the disorganization in the municipals market, rumors about the solvency and liquidity of savings institutions, and the frantic [funding] efforts by money-center banks generated what can be characterized as a controlled panic.” Not allowed to bid competitive rates for deposits, as the St. Louis Fed’s history of the credit crunch reports: “Banks had never before experienced a large outflow of time deposits.”
So the Fed fixed prices and the result was the credit crunch. Following Wojnilower’s lively account: “Lending to all but the most established and necessitous customers was halted abruptly. Chief executives of leading banks reportedly were humbled to the point of pleading with their counterparts in industry to renew their CDs.” Further, in order to the raise needed funds, there was “the apparent inevitability of massive distress sales of long-term assets into a paralyzed marketplace.”
Who came to the rescue? The cause of the problem. “The gravity of the situation penetrated to an initially incredulous Federal Reserve,” Wojnilower continues. Banks were invited to borrow at the discount window in the face of “the very lively fears that major banks might have to close their doors.”
The shock of the credit crunch led the Fed into “a long-lasting series of private and public reassurances that no such crisis would ever be permitted to recur.” How did that work out? Three years later came the more severe credit crunch of 1969. As economist Charlotte E. Ruebling wrote at the time, “market interest rates have soared to levels never before reached in this country,” but “rates on deposits at banks and other financial institutions have been held much lower.” By the Fed, of course.
The authors of Regulation Q had a really bad idea, based on the false assumption that the Fed would somehow know the right answer. But the Fed did not know what the right interest rate was in 1966, or 1969—nor do they know it now. They never have and cannot know it. Put not your faith in their dubious “expertise.”
Negative rates aren’t working. Why do central banks persist?
Published in Real Clear Markets with Paul Kupiec.
Monetary policies in Europe and Japan have produced trillions of dollars of bonds with negative nominal interest rates in the hope of stimulating economic growth. Indeed, the Bank of Japan’s recent policy announcement doubles-down on this strategy by pledging to cap 10-year Japanese government bond yields at zero until the central bank hits its 2 percent inflation target.
But there is little evidence that negative interest rates are stimulating economic growth. Economic data suggest that consumers are actually saving more in countries with negative interest rates. And business investment, far from being stimulated by near-zero borrowing costs, is weak across the board. It’s time for a critical reassessment of unconventional post-crisis monetary policy experiments.
A typical consumer’s lifecycle has three phases – a borrowing phase, a saving phase and a phase for consuming savings in retirement. The aging of developed countries has increased the economic importance of the latter two lifecycle phases. While negative real interest rates benefit borrowing households, they are a tax on savers and those in retirement.
With negative nominal interest rates, prudently sock away your income for years and you are certain to receive less money than you invested. On top of that, monetary authorities worldwide target perpetual inflation, so chances are that you will face a higher price level in the future. Faced with this double whammy, economists predict that consumers should spend rather than save, but the data strongly suggest that households are compensating for negative interest rates by saving more, not less.
Recent OECD data show that, as average short-term interest rates turned negative, household savings rates increased in Switzerland, Germany, Sweden, Denmark and Japan. The OECD forecasts decade-high household savings rates in 2016 for all these countries except Japan.
Recent negative and near-zero interest rate policies have also had unanticipated impacts on business investment. If businesses followed economic textbooks, they would invest in activities that are profitable when expected revenues and costs are discounted using their average cost of funds. Under this decision rule, investment should increase when monetary policies force interest rates to zero or below, because more investments are profitable when a business’ cost of borrowing falls.
But many business mangers apparently skipped this economics lecture. Research has shown that many firms evaluate investments by discounting future cash flows using a management-set hurdle rate, not their firm’s cost of raising new funds. Survey evidence finds that firms set investment hurdle rates between 12 to 15 percent for investments similar to their existing business lines, and significantly higher for new business ventures.
Moreover, the evidence from multiple countries suggests that business hurdle rates are “sticky” over time. Firms do not appear to adjust their hurdle rates in response to changes in short-term interest rates. For example, a recent Federal Reserve Board study concludes that business investment hurdle rates have changed little since the 1980s, despite nearly double-digit declines in corporate borrowing costs.
The missing piece in the business investment puzzle is uncertainty. When businesses perceive high downside risks, they wait to invest. The delay allows firms to acquire new information and avoid potential downside losses by postponing investing until the data confirm an improved outlook. This behavior mimics the Federal Reserve and other monetary authorities’ habit of delaying action until additional data confirm the underlying economic trend.
The option to wait has the potential to put a huge drag on business investment. When monetary authorities use highly publicized, radical approaches like QE and negative interest rates and justify the policies as “insurance” against a deflationary spiral, they are themselves creating uncertainty. The more monetary authorities push the negative interest rate frontier to save their economies from disaster, the bigger the uncertainty they telegraph to businesses and consumers about downside risks.
Against mounting evidence, it is becoming harder to cling to the theory that near-zero and negative interest rates stimulate economic growth. When rates are negative, savers appear to save more, not less; retirees consume less to conserve their nest eggs; and business investment stagnates, as the value of the option to wait for an improved economic outlook grows.
But near-zero and negative interest rates do have one beneficiary – governments. Near zero and negative nominal rates reduce budget deficits because governments borrow virtually for free or even get paid to issue debt. So although near-zero and negative interest rates cloud the outlook for economic growth, these monetary policies have provided a silver lining for treasuries and finance ministries.
Taking on Leviathan
Published in the Thomas Hobbes (1588-1679), the great philosopher of the authoritarian state, in a famous metaphor portrayed the government as a dominating giant or Leviathan, animated by absolute sovereignty, and passing out rewards and punishments as it saw fit. It alone could control the unruly passions of the people and create stability and safety.
Today’s “administrative state”—or government bureaucracy, acting simultaneously as sovereign legislator, executive, and judge—brings Hobbes’ image of the giant vividly to mind.Nowhere is his metaphor more apt than in the government’s attempts at “systemic financial stability.” Hobbes’ 21st century acolytes include former Senator Chris Dodd (D-Conn.) and former Congressman Barney Frank (D-Mass.), whose Dodd-Frank Act sought to prevent financial crises, as Hobbes sought to prevent civil wars, by enlarging the giant. Now, as then, how to control the unruly passions, lust for power, and misguided enthusiasms of the state itself is left unanswered.
However, Congressman Jeb Hensarling (R-Tex.), who chairs the House Financial Services Committee, is now taking on Leviathan in the financial system with the proposed Creating Hope and Opportunity for Investors, Consumers and Entrepreneurs (CHOICE) Act. If it seems unlikely that he could fell the giant altogether, perhaps he could limit and better control and confine it, at least with respect to banking and the people’s money. If he succeeded, the federal government would place more emphasis on competitive markets and less on the diktats of the central bank and regulatory bureaucrats whom Dodd-Frank made sovereign.
Writing his book Leviathan in 1651, in the wake of the English Civil War and the beheading of King Charles I, Hobbes had this to say: “By art is created that great LEVIATHAN called a COMMONWEALTH or STATE (in Latin, CIVITAS), which is but an artificial man, though of much greater stature and strength.”
He went on:
sovereignty is an artificial soul, as giving life and motion to the whole body; the magistrates and other officers of judicature and execution, artificial joints; reward and punishment (by which fastened to the seat of the sovereignty, every joint and member is moved to perform his duty) are the nerves.
Moreover,
Salus Populi (the people’s safety) its business; counsellors, by whom all things needful to know are suggested unto it, are the memory; equity and laws, an artificial reason and will; concord, health; sedition, sickness; and civil war, death.
Writing four decades before the founding of the Bank of England, Hobbes can be forgiven for not mentioning the central bank, which has since become a key element of sovereignty. We need to extend his metaphor to include it. We could say that the central bank is a kind of artificial heart pumping the circulating blood of credit and money, making sure to lend the government as much as it wants. It often pumps this blood of credit to an excessive extent, causing financial markets to inflate, be overly sanguine, then bust, constrict their flows and suffer the heart attacks of financial panics.
Three centuries or so after Hobbes, Leviathan developed a new capability: that of constructing vast shell games guaranteeing huge quantities of other people’s debt and taking vast financial risks, while pretending that it wasn’t doing this, and keeping this debt off the books. I refer to the invention of government-sponsored enterprises like Fannie Mae and Freddie Mac, and to related schemes such as government-sponsored insurance companies, like the Federal Savings and Loan Insurance Corporation and the Pension Benefit Guaranty Corporation. All serve as Leviathan’s artificial stomach and gluttonous appetite for risk, causing in time obesity, flatulence, indigestion, and finally the heartburn of publicly admitted insolvency.
Although financial panics temporarily render Leviathan stunned and confused, in short order it resumes its energetic activity and ambitious pursuit of greater power. Writing legislation in 2010, in the wake of the financial crisis of 2007 to 2009, Senator Dodd and Representative Frank ordered Leviathan to make deep expansions into the financial sector. The people’s financial safety and concord became defined as a new supreme demand for “compliance” with the orders of government bureaucrats, who were assumed to know the right answers.
The Dodd-Frank Act was passed in 2010 on party line votes at a time of insuperable Democratic majorities in both houses of Congress. Shortly after voting it in, the Democrats suffered stinging losses in that year’s congressional elections. No subsequent Congress would ever have dreamed of passing anything remotely resembling Dodd-Frank, but financial Leviathan had already been put on steroids and unleashed.
Now comes Chairman Hensarling to try to bring financial Leviathan back under control. The CHOICE Act would reform Leviathan’s activity in a wide swath of financial areas. It would:
Remove onerous Dodd-Frank burdens on banks that maintain a high tangible capital ratio (defined as 10 percent of total assets), thus creating a simple rule instead of the notoriously complex ones now in force.
Force the Financial Stability Oversight Council into greater transparency by cutting back the power of this committee of regulators to make opaque decisions in secret.
Correct the egregiously undemocratic governance of another bureaucratic invention, the Consumer Financial Protection Bureau, by giving it a bipartisan board and subjecting it to the congressional oversight and appropriations process that every federal agency should have.
Require greater accountability and transparency from Leviathan’s heart, the Federal Reserve.
Require cost-benefit analysis for new regulations and a subsequent measurement of whether they achieved their goals—imagine that!
Repeal the “Chevron Doctrine” that leads judges to defer to federal agencies. This is essential, as bureaucrats make ever-bolder excursions beyond their legal authority.
Take numerous steps to relieve Leviathan’s heavy hand on small businesses and small banks.
The CHOICE Act will likely be taken up by the House Financial Services Committee this fall—and be ready for further consideration if, as is forecast by most people, Republicans retain control of the House of Representatives in the upcoming election. The debates about the bill will be contentious and sharply partisan, with vehement opposition from those who love Leviathan. How far the reform bill can go depends on how other parts of the election turn out.
Will financial Leviathan grow ever fatter, more arrogant, and more intrusive? Or can it be put on a long-term diet by constraining its arrogance, correcting its pretensions, imbuing its artificial soul with behavior befitting a republic, and put in the service of a limited government of checks and balances?
The CHOICE Act is a good start at this daunting and essential project.
The new century brings remarkable downshift in per-capita GDP growth
Published in Real Clear Markets.
For the half-century from 1950 to 2000, U.S. real gross domestic product per capita grew at an average rate of 2.22 percent per year. For the first 15 years of the 21st century so far, this key measure of the overall standard of living has grown, on average, at only 0.89 percent.
Of course, a growth rate per person of 0.89 percent is still growth, and growth in output per person sustained over years is still a notable achievement of the market economy.
But the difference between growth rates of something over 2 percent and a little less than 1 percent is a very big deal. How much difference does that drop make, if it continues? Thanks to the always-surprising power of compound growth rates over time, the difference in the resulting long-term standard of living is huge.
In a lifetime of 80 years, for example, per capita GDP growth of 0.89 percent per year will double the economic standard of living-on average, people will become twice as well off as before. But with a growth rate of 2.22 percent, GDP per capita will more than quintuple in the same 80 years-people will be five times as well off. Such amazing improvement has actually happened historically beginning with the economic revolutions of the 19th century and continuing through the 20th. In 1950, U.S. real per capita GDP was $14,886 (using constant 2009 dollars). By 2000, it was $44, 721-thus 3X in 50 years.
The downshift of our new century is apparent when we look at the average growth rates in successive 15-year periods, as shown in the table.
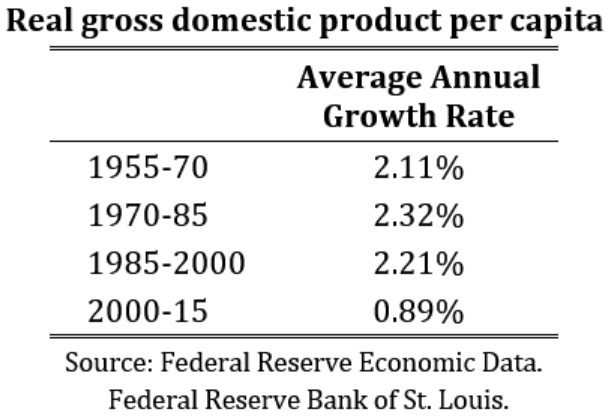
Why the downshift and will it continue? The answer, as with so many things in economics, is that we do not know.
One theory now proposed is “secular stagnation.” This is not really so much a theory as giving a different name to slower growth rates. “Stagnation” was also a noted economic assertion in the 1940s– just before the postwar boom and on the verge of 50 years of solid growth. The great economist, Joseph Schumpeter, writing in 1949 on “modern stagnationism,” observed that “stagnationist moods had been voiced, at intervals, by many economists before.” Now they are being voiced again. They were always wrong before. Will they be right this time?
Among the factors we may speculate contribute to the markedly slower growth in real per capita GDP of this century are: the drag from financial crises and their resource misallocations; the aging of the population, with lower birth rates and long retirements; the fall in labor participation rates, so there are fewer producers as a percent of the population; the ever-more oppressive tangle of government regulations, so that “compliance” with the orders issued by bureaucrats becomes the top priority; and the massive monetary distortions of central banks, pretending to know what they are doing.
Can all this continue to suppress the underlying growth dynamic of scientific advance, innovation, entrepreneurship and enterprise of a market economy? Unless the government interventions get a lot worse (which they may!), I believe the current stagnationists will likely join their historical predecessors among the ranks of the false prophets. Let us hope so.
‘Commercial’ bank is misnomer. ‘Real estate’ bank is more apt
Published in American Banker.
Comparing banking in the 1950s to today, we find giant changes that surely would have astonished the bankers of that earlier time. What’s the biggest and most important one?
You might nominate the shrinkage in the total number of U.S. banks from over 13,200 in 1955 to only about 5,300 now — a 60 percent reduction. Or you might say the rise of interstate banking, or digital technology going from zero to ubiquitous, or the growth of financial derivatives into hundreds of trillions of dollars, or even air conditioning making banking facilities a lot more pleasant.
You might point out that the whole banking industry’s total assets were only $209 billion in 1955, less than one-tenth the assets of today’s JPMorgan Chase, compared with $15 trillion now. Or that total banking system equity was $15 billion, less than 1 percent of the $1.7 trillion it is now. Of course, there have been six decades of inflation and economic growth. The nominal gross domestic product of the United States was $426 billion in 1955, compared with $17.9 trillion in 2015. So banking assets were 49 percent of GDP in 1955, compared with 83 percent of GDP now.

But I propose that the biggest banking change during the last 60 years is none of these. It is instead the dramatic shift to real estate finance and thus real estate risk, as the dominant factor in the balance sheet of the entire banking system. It is the evolution of the banking system from being principally business banks to being principally real estate banks.
In 1955, commercial and industrial loans were 40 percent of total banking loans and real estate loans only 25 percent. The great banking transition set in after 1984. The share of C&I loans kept falling, down to about 20 percent of total loans, while real estate loans rose to about 50 percent, with a bubble-induced peak of 60 percent in 2009. In this remarkable long-term shift, the share of real estate loans doubled, while the share of commercial and industrial loans dropped in half. The lines crossed in 1987, three decades ago and never met again, despite the real estate lending busts of the early 1990s and of 2007-9.
The long-term transition to concentration in real estate would have greatly surprised the authors of the original National Banking Act of 1864, which prohibited national banks from making any real estate loans at all. This was loosened slightly 1913 by the Federal Reserve Act and significantly in 1927 by the McFadden Act — in time for the ill-fated real estate boom of the late 1920s.
The real estate concentration is even more pronounced for smaller banks. For the 4,700 banks with assets of less than $1 billion, real estate loans are 75 percent of all loans, about the same as their bubble-era peak of 76 percent.
Moreover, in another dramatic change from the 1950s, the securities portfolio of the banking system has also become heavily concentrated in real estate risk. Real estate securities reached 74 percent of total banking system securities at the height of the housing bubble. They have since moderated, to 60 percent, but that is still high.
In terms of both their lending and securities portfolios, we find that commercial banks have become basically real estate banks.
Needless to say, this matters a lot for understanding the riskiness of the banking system. The assets underlying real estate loans and securities are by definition illiquid. The prices of these assets are volatile and subject to enthusiastic run-ups and panicked, unexpected drops. When highly leveraged on bank balance sheets, real estate over banking’s long history has been the most reliable and recurring source of busts and panics.
A good example is the frequency of commercial bank failures in 2007-12 relative to their increasing ratio of real estate loans to total loans at the outset of the crisis in December 2007. From the first quartile, in which real estate loans are less than 57 percent of loans, to the third quartile, in which they are over 72 percent, the frequency of failure triples, and failures are nine times as great for the highest ratio quartile as for the lowest. In the fourth quartile, real estate loans exceeded 83 percent of loans, and the failure rate is over 13 percent, which represents 60 percent of all the failures in the aftermath of the bubble. The 50 percent of banks with the highest real estate loan ratios accounted for 82 percent of the failures.
Central to the riskiness of leveraged real estate is the risk of real estate prices falling rapidly from high levels — and right now those prices are again very high. The Comptroller of the Currency’s current “Risk Perspective” cites rapid growth in commercial real estate loans, “accompanied by weaker underwriting standards” and “concentration risk.”
The predominance of real estate finance in banking’s aggregate banking balance sheet makes that risk far more important to the stability of the banking system than the bankers of the 1950s could ever have imagined.
Who will pay for the Pension Benefit Guaranty Corp.’s huge losses?
Published in Real Clear Markets.
The government’s pension insurance company, the Pension Benefit Guaranty Corporation (PBGC), is broke. Because its creditors can’t demand their money immediately, it won’t have spent
its last dollar for “a significant number of years” yet (maybe ten) — but its liabilities of $164 billion are nearly twice its assets of $88 billion: there is no way it can honor all its obligations.
The PBGC has two programs, one insures single employer pensions and the other multiemployer, union-sponsored pensions. Both are insolvent, but the multiemployer program is in far worse shape: it is well and truly broke. Its liabilities of $54 billion are 27 times its assets of $2 billion. There are on top of that “reasonably possible” losses of another $20 billion.
The PBGC was supposed to be, according to its charter act, financially self-supporting: obviously it isn’t. Also according to the act, its liabilities are not obligations of the United States government: but it couldn’t continue to exist even for a minute except as part of the government. Will the taxpayers end up paying for its losses-or if not, who?
A month ago (June 17, 2016), Labor SecretaryThomas Perez, who chairs the PBGC board, wrote disingenuously to the Congress, that the board wants to work with Congress “to ensure the continued solvency of the multiemployer program.” A forthright statement would have been: “to address the disastrous insolvency of the multiemployer program.”
In the background of the PBGC’s huge net worth deficit are a large number of deeply underfunded multiemployer pension funds. “Overall,” Perez’s letter admitted, “plan assets in the multiemployer pension system are now less than half of earned benefits.” You could call that underfunding with a vengeance.
An instructive example is the Central States plan (formally, the Teamsters union’s Central States, Southeast and Southwest Areas Pension Fund). The financial stress of this large and utterly insolvent multiemployer plan brings the inescapable problems into sharp focus. As an officially “critical and declining” multiemployer pension plan, Central States was able under the Kline-Miller Multiemployer Pension Reform Act of 2014, to submit a plan, which ran to 8,000 pages, to reduce its pension obligations to a level more in line with its assets and income. The reduced pensions under this proposal, consistent with the 2014 act, would still have been higher than if the fund went into the PBGC.
The U.S. Treasury Department rejected the proposed plan, pointing out various technical shortcomings and the hard fact that even with the pension reductions, the proposal did not fix Central States’ long-term insolvency-which is indeed a requirement included in the 2014 act (put in, apparently, at the insistence of the Democratic legislators). This has the ironic result, as the Washington Post editorialized, that “if Central States collapses and the PBGC takes over, retirees would, by law, get even less than they would under the just-rejected proposal.” And that is assuming that the PBGC itself can pay its obligations over time, which it can’t.
Some observers have suggested that the Treasury’s motivation was political rather than technical. In other words, that the incumbent administration could not afford to approve any reduction, even if a better deal than the PBGC would provide, in the pension benefits of a union-sponsored pension plan, no matter how broke that plan is.
Of course, the Treasury’s action leaves Central States just as broke as it was before, the multiemployer pension system just as hopelessly underfunded as it was before, the PBGC’s multiemployer program just as broke as it was before, and the overall PBGC the same.
Let’s consider the fundamental truths. The money needed to pay the pension obligations of Central States was simply not put into the pension fund, so it’s not there to pay them. The money needed to pay the pension obligations of the multiemployer pension system as a whole was simply not put into the funds, so it’s not there to pay them. The insurance premiums needed to make the PBGC able to honor its insurance obligations were not set at the necessary levels and were therefore not collected, so it is not there to pay them.
The resulting deficits are huge and real. Someone is consequently going to suffer the losses which are unavoidable because they have already happened. Who is that someone?
There are multiple candidates for taking or sharing in the losses:
1. The pension beneficiaries who have claims on insolvent pension plans. Their pensions could be reduced, as in the Detroit bankruptcy, or if they are still working, their own contributions to the pension plans significantly increased, or both. Also, they might start paying individual insurance premiums to the PBGC, just as government-insured mortgage borrowers pay individual premiums to the Federal Housing Administration.
2. The employers who unwisely committed to pension plans whose benefits have proved unpayable. They could make much bigger contributions to funding the plans, or pay vastly higher insurance premiums to the PBGC, or both.
3. The union sponsors of the multiemployer plans. They could be removed from any control of insolvent multiemployer plans, in effect putting such plans into PBGC receivership, as in a normal insolvency proceeding and as with failed single employer pension plans. There is no reason for multiemployer plans to be different. But as it is now, the PBGC merely pays the tab for failed multiemployer plans.
4. The creditors of employers. The deficit of a pension plan is an unsecured creditor’s claim on the employer. That could be made a senior claim, just as deposits were made senior claims on banks after the financial crisis of the 1980s. This would force some of the burden on to other creditors of failed employers.
5. Taxpayers. It is inevitable that a taxpayer bailout will be proposed, despite the pious statutory assurance that PBGC’s debts are not government obligations. Against this proposal, it will be fairly asked why people with no pensions themselves or who don’t have defined benefit pensions should pay for those who do have them-a good question. On the other side, the hardship of existing pensioners of insolvent pension funds will be sincerely urged.
6. Some combination of the above.
Needless to say, whoever ultimately has to take the unavoidable losses will not like it.
Consider this striking historical parallel to the probable fate of the PBGC’s multiemployer program: the decade-long descent into humiliating failure of the government’s deposit insurer, the Federal Savings and Loan Insurance Corporation (FSLIC). This government insurer, along with the savings and loan industry whose obligations it guaranteed, sank into a sea of insolvency in the 1980s. When this finally had to be publicly confessed, FSLIC became notorious. It certainly seems that the PBGC is the new FSLIC.
In tracking homeownership, marriage matters
Published in Real Clear Policy with Jay Brinkmann.
Homeownership long has been considered a key metric for economic well-being in the United States. Thus, many are dismayed by the fact that, at 63.5 percent, the 2015 overall homeownership rate appears to be lower than the 64.3 percent of 1985, a generation ago. But viewed in another, arguably more relevant way, the underlying trend shows the homeownership rate is, in fact, increasing, not decreasing.
How so? Key to the trend is the extremely strong relationship between marriage and homeownership — a relationship seldom, if ever, addressed in housing-finance discussions. But if you think about it, it’s obvious that homeownership should be higher among married couples than among other households; in fact, it’s remarkably higher.
This relationship holds across all demographic groups. Importantly, it means that changes in the proportion of married versus not-married households is a major driver of changes in the overall homeownership rate over time. Homeownership comparisons among demographic groups are similarly influenced by differences in their respective proportions of married versus not-married households.
Policy discussions over falling homeownership rates frequently ignore some critical underlying demographic facts.
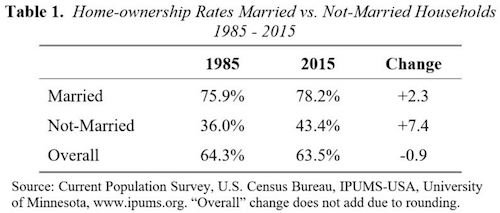
The current 63.5 percent American homeownership rate combines two very different components: married households, with about 78 percent homeownership, and not-married households, with only 43 percent homeownership. Married households have a homeownership rate 1.8 times higher — obviously a big difference. (As we have organized the data, these two categories comprise all households: “married” means married with spouses present or widowed; “Not-married” means never married, divorced, separated or spouse absent.)
Table 1 contrasts homeownership by married versus not-married households, showing how these homeownership rates have changed since 1985.
One is immediately struck by a seeming paradox:
The homeownership rate for married households has gone up by 2.3 percentage points.
The homeownership rate for not-married households has gone up even more, by 7.4 percentage points.
But the overall homeownership rate has gone down.
How is this possible? The answer is that the overall homeownership rate has fallen because the percentage of not-married households has dramatically increased over these three decades. Correspondingly, married households (which have a higher homeownership rate) are now a smaller proportion of the total. Still, homeownership rose for both component parts. So the analysis of the two parts gives a truer picture of the underlying rising trend.
The dramatic shift in household mix is shown in Table 2.
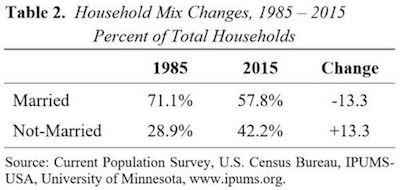
Table 3 shows that the strong contrast between married and not-married homeownership rates and related changes from 1985-2015 hold for each demographic group we examined.
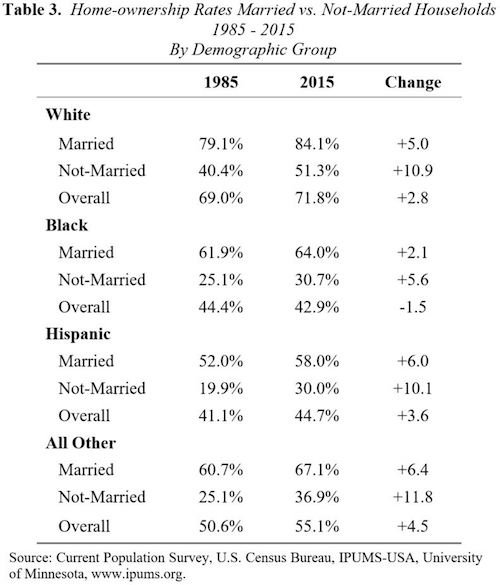
That is, homeownership for both married and not-married households went up significantly for all four demographic groups from 1985 to 2015.
Moreover, overall homeownership also increased for three of these four groups. Homeownership for black households, meanwhile, fell by 1.5 percentage points, though homeownership for both married and not-married components rose for this demographic as well. (This is consistent with that group’s showing the biggest shift from married to not-married households.)
In another seeming paradox, Hispanic homeownership rates rose, while still contributing to a reduction in the overall U.S. rate. The reason for this is that their share of the population more than doubled, increasing the weight of their relatively high share of not-married households.
The trends by group in the mix of married versus not-married households are shown in Table 4.
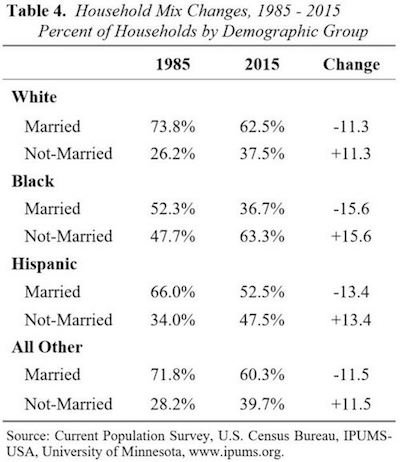
What would the U.S. homeownership rate be if the proportions of married and not-married households were the same as in 1985? Applying the 2015 homeownership rates for married and not-married households to the mix that existed in 1985 results in a pro forma U.S. homeownership rate of 68.1 percent. This would be significantly greater than both the 1985 level of 64.3 percent and the 2015 measured level of 63.5 percent.
Adjusting for the changing mix of married versus not-married households gives policymakers a better understanding of the underlying trends. This improved understanding is particularly important when weaker credit standards are proposed as a government solution to the lower overall homeownership rate.
To make sense of homeownership rates, we have to consider changes in the mix of married versus not-married households. And these changes have been dramatic over the last 30 years.
The perfect antidote to Dodd-Frank
Published in American Banker.
To overhaul the Dodd-Frank Act, here is a radical and really good idea from House Financial Services Committee Chairman Jeb Hensarling, R-Texas.
The Financial CHOICE Act, Hensarling’s bill, says to U.S. banks: “Don’t like the endless additional regulation imposed on you by the bloated Dodd-Frank Act? Get your equity capital up high enough and you can purge yourself of a lot of the regulatory burden, deadweight cost and bureaucrats’ power grabs – all of which Dodd-Frank called forth.”
This Choice bill, which stands for Creating Hope and Opportunity for Investors, Consumers and Entrepreneurs, is not an order to increase your capital. Rather, it’s offering a logical choice.
Option 1: Put enough of your equity investors’ own money in between your creditors and the risk that other people will have to bail them out if you make big mistakes. And you may. Then, the government can’t claim you live on the taxpayers’ credit, and therefore, can’t justify its inherent urge to micromanage.
Option 2: Don’t get your equity capital up high enough and live with the luxuriant regulation instead. Think of this scenario as the imposed cost of using the taxpayers’ capital instead of your own to support your risks.
Depending on how large the explicit costs and the opportunity costs of the regulation are, you might think that the second option will yield higher returns on equity than option one or you might not. Some banks would choose one option, while some would choose the other.
Different choices would create diversification in the banking sector. They would also create highly useful learning over time. One group would end up sounder and make greater contributions to economic growth and innovation. One group would, over time, prosper more than the other.
Of course, we have to answer: how high is high enough? The 10 percent tangible leverage capital required to get the deal in the proposed legislation is a lot more than now, but is it even enough?
To consider the matter first in principle: surely, there is some level of equity capital at which this trade-off makes sense, some level at which everyone — even habitual lovers of bureaucracy — would agree that the Dodd-Frank burdens would be superfluous, or at least, cause costs far in excess of their benefits.
What capital ratio is exactly right can be, and is, disputed. Because government guarantees, mandates and interventions are so intertwined with today’s banks, there is simply no market answer available. Numerous proposals, based on more or less no data, have been made. The fact that no one knows the exact answer should not, however, stop us from moving in the right direction.
Among various theories, economist and New York Times columnist Paul Krugman proposed a maximum assets-to-capital ratio of 15:1, which means a minimum leverage capital ratio of 6.7 percent. Anat Admati, a Stanford finance professor, and Martin Hellwig, an economics professor at the University of Bonn, argued for a 20 percent to 30 percent leverage capital requirement with no empirical analysis. Economists David Miles, Jing Yang and Gilberto Marcheggiano estimated that the optimal bank capital is about 20 percent of risk-weighted assets, which in their view means 7 percent to 10 percent leverage capital, in a white paper. A group of 20 academics from finance and banking specializations suggested in a letter to the Financial Times a 15 percent leverage capital requirement. Economists Anil Kashyap, Samuel Hanson and Jeremy Stein proposed 12 percent to 15 percent risk-weighted, which means about 6 percent to 8 percent leverage capital. Professor Charles Calomiris suggested 10 percent leverage capital. Economist William Cline estimated the optimal leverage capital ratio at 6.6 percent to 7.9 percent. Robert Jenkins, a member of the financial policy committee at the Bank of England, gave a speech to the Worshipful Company of Actuaries entitled “Let’s Make a Deal,” where the deal was the “rollback of the rule book” in exchange for raising “equity capital to 20 percent of assets.” In my opinion, the 10 percent tangible leverage capital ratio in Hensarling’s bill is a fair stab at it.
In exchange for 10 percent leverage capital, it is essential to understand that the deal is not to eliminate all regulation. Indeed, there would still be plenty of regulation for banks taking the deal. However, option one is a distinctly better choice than the notorious overreaction and overreach of Dodd-Frank. In exchange for a further move to 20 percent leverage capital, one would rationally eliminate a lot more regulation and bureaucratic power.
It’s also essential to understand that the proposed capital ratio as specified in the Hensarling bill subtracts all intangible assets and deferred-tax assets from the allowable capital and adds the balance sheet equivalents of off-balance sheet items to total assets. Thus, it is conservative in both the numerator and denominator of the ratio.
In my judgment, the choice offered to banks by Chairman Hensarling’s proposal makes perfect sense. It goes in the right direction and ought to be enacted. Even the Washington Post editorial board agrees with this. In an op-ed, the editorial board writes:
More promising, and more creative is Mr. Hensarling’s plan to offer relief from some of Dodd-Frank’s more onerous oversight provisions to banks that hold at least 10 percent capital as a buffer against losses…such a cash cushion can offer as much—or more—protection against financial instability as intrusive regulations do, and do so more simply.
Very true!
The PBGC: A broke insurance company sponsored by your government
Published in Real Clear Markets.
Imagine an insurance company with assets of $88 billion, but liabilities of $164 billion. It has a huge deficit: a net worth of a negative $76 billion, and a capital-to-asset ratio of minus 87 percent.
Would any insurance commissioner anywhere allow it to remain open and to keep taking premiums from the public to “insure” losses it manifestly cannot pay? Of course not. Would any rational customer buy an insurance policy from it, when the company cannot even hope to honor its commitments? Nope.
But there is such an insurance company, open and in business and taking in new premiums for obligations it will not be able to pay. Needless to say, it is a government insurance company, since no private entity could continue in business in such pathetic financial shape. It is the Pension Benefit Guaranty Corp. (PBGC), a corporation wholly owned by the U.S. government, operating on an obviously failed model. Its board of directors comprises the secretaries of the departments of Labor, Commerce and the Treasury; quite a distinguished board for such egregious results.
There are two financially separate parts of the PBGC: the Single-Employer Program, which insures the defined-benefit pension plans of individual companies; and the Multiemployer Program, which insures union-sponsored plans with multiple companies making pension contributions. The Single-Employer Program has a large deficit, with assets of $86 billion, liabilities of $110 billion and a negative net worth of $24 billion. That is bad enough.
But now imagine an insurance company with assets of $2 billion and liabilities of $54 billion. That is a truly remarkable relationship. Its net worth is negative $52 billion, or 26 times its assets. That is the PBGC’s Multiemployer Program – which, as no one can doubt, is well on the way to hitting the wall.
The PBGC can continue to exist for only two reasons: because the government forces pension plans to buy insurance from it and because its political supporters entertain the abiding hope that Congress will somehow or another give it a lot of other people’s money to cover its unpayable obligations.
Congress should not do this, and so far, it has shown no inclination to announce a taxpayer bailout. But the real simultaneous financial and political crunch will occur when the disastrous Multiemployer Program runs out of cash while still being oversupplied with obligations. This moment is readily foreseeable, but has not yet arrived and is estimated to be a number of years off.
The PBGC was created by the Employment Retirement Income Security Act of 1974 (ERISA). This put into statue an idea created by the research department of the United Auto Workers union in 1961: let’s get the government to guarantee our pensions. The idea was politically brilliant but, financially, less brilliant.
According to the law, the PBGC was not supposed to be able to get itself into the insolvent status in which it not finds itself. As each PBGC Annual Report always informs us, “ERISA requires that PBGC programs be self-financing.” But they aren’t—not by a long shot, where the value of that long shot is at least $76 billion. What does the “requirement by law” to be self-financing mean when you aren’t and have no hopes to be so?
One thing originally intended to be quite clear we find in the next Annual Report sentence: “ERISA provides that the U.S. Government is not liable for any obligation or liability incurred by PBGC.” To repeat: Not liable. But of course, they said the same thing in statute about Fannie Mae and Freddie Mac. They made Fannie and Freddie put that in bold face type on every memorandum offering their debt for sale. But they bailed out Fannie and Freddie anyway.
As it has turned out, the Fannie and Freddie bailout has proved to provide a positive investment return to the taxpayers: an internal rate of return of about 7 percent so far. But any bailout money put into the PBGC will be simply gone. It would not be an investment, but purely a transfer payment.
That reflects the fact that Fannie and Freddie, when their operations were not perverted by politically mandated excess risk, had a fundamental model capable of making profits, as they did before the housing bubble and now are again. This profit potential is not shared by the PBGC. Its fundamental model is to take politically mandated excess risk in order to promote unaffordable pensions, not to insure them according to rational actuarial principles.
Defined-benefit pension plans have proved beyond doubt to be an extremely risky financial construction. The idea that the government is guaranteeing them encouraged the negotiation of pensions unaffordable to the sponsors in the first place, and the underfunding of pension obligations later. These are the kinds of very costly moral hazards entailed in the very existence of the PBGC. Of course, the PBGC might have, had Congress allowed it to, charged vastly higher premiums. But this would be against the other of its assigned missions: to encourage and promote defined-benefit pensions.
You can understand how this was felt to be a nice idea, but it creates an irresolvable conflict for the PBGC. The corporation is simultaneously supposed to promote the use and survival of defined-benefit pension programs, while it is also supposed to run a sound, self-financing insurance company. Obviously, it has utterly failed at being a sound insurer. Arguably, by creating incentives to design unaffordable pensions, it also failed at promoting defined-benefit pension plans, and has rather accelerated their ongoing demise.
There is no easy answer to the PBGC problem as a whole, but Congress took a sensible and meaningful step with the Kline-Miller Multiemployer Pension Reform Act of 2014. We will devote the next essay to examining the implications of this act and the reasonable attempt to use it recently thwarted by the U.S. Treasury Department.
How high are real house prices?
Published in Real Clear Markets.
“Home prices are back to near-record highs across the U.S.” declared the Wall Street Journal in a June 1 front-page story. They are, indeed, when measured in nominal terms.
The Case-Shiller National House Price Index for the first quarter of 2016 is as high as it was in September 2005, in the late-phase frenzy of the bubble. That was only nine months before the 2006 bubble-market top, which as we know only too well, was followed by collapse. In addition to reaching its 2005 level, the National House Price Index has gone back to well over its trend line—more than 11 percent over. All this is shown in Graph 1.

So the Federal Reserve has gotten its wish for re-inflated house prices (although not its wish for robust economic growth).
Are high house prices good or bad? That depends on whether you are selling or buying. If you are the Fed, it depends on how much you believe that creating asset-price inflation leads to “wealth effects” that improve economic growth.
Of course, besides asset-price inflation, the Fed truly believes in regular old inflation. It has often announced its intent to create perpetual increases in consumer prices. Since the bubble top in 2006, the Consumer Price Index has increased by an aggregate of 17 percent.
This means that house prices – measured in real, inflation-adjusted terms – look different from Graph 1. Real house prices are shown in Graph 2, expressed in constant 2000 dollars. They have still gone up a lot in the last few years, but not as much as in nominal terms. They have matched their level from October 2003, rather than September 2005.

In October 2003, house prices were clearly inflating: they were half way, but only half way, up their memorable bubble run from 1999 to 2006. Do we remember how happy so many people were with those high house prices? Do we remember that the Fed Funds Rate had then been reduced to 1 percent? That the Fed was thinking of wealth effects? At the time (in January 2004), the Wall Street Journal published an article entitled, “Housing Prices Continue to Rise.” It reported that “the decline in interest rates has made housing more affordable,” that forecasts were for “the house party to rage on in 2004”—a good forecast— and that “few housing pundits see much risk of a national plunge in house prices”—a terrible forecast.
In 2003, was it time to pay attention? It was. Going forward from here, can we imagine what house prices would be with genuinely normalized interest rates? In mid-2016, can the pundits see much risk of anything going wrong?
Power, independence and guessing
Published in Library Of Law & Liberty.
The Power and Independence of the Federal Reserve is an informative and provocative history of the Fed and its remarkable evolution over a hundred years’ time: a complex institution, in a complex and changing environment.
Very importantly, author Peter Conti-Brown has included the Fed’s intellectual evolution, or the shifting of the ideas that shape its actions as these ideas go in and out of central banking fashion. This account makes readers wonder what new ideas and theories the leaders of the Fed will adopt, reinforce by groupthink with their fellow central bankers, and try out on us in future years.
As for the power wielded by the Fed, it has obviously come a very long way since its beginnings, when it was, as Conti-Brown describes it, “an obscure backwater government agency.” That is hard for today’s Americans to imagine. To illustrate the change, Conti-Brown relates the memorable story of when the new Federal Reserve Board went to President Wilson’s Secretary of the Treasury, William McAdoo, to complain that at a state function the board members were not given sufficient prominence in order of seating. McAdoo took the problem to Wilson. “Well, they might come right after the fire department,” replied the irritated President.
Little could he know that the Fed would become, in time, the global financial fire department, as part of being central bank to a world in which its fiat dollars were the dominant currency.
Of course the Fed has made, and doubtless will continue to make, great mistakes. Its enormous power, combined with its unavoidable human fallibility, renders it without question the most dangerous financial institution in the world—far and away the greatest potential creator of systemic financial risk there is.
Put that together with the other idea in Conti-Brown’s title: independence. He considers many factors affecting the independence the Fed so much wants and so energetically defends. He rightly emphasizes something as crucial as it is little-discussed: the Fed’s budgetary independence. The Fed, as Conti-Brown points out, is entirely free from the “power of the purse” normally exercised by Congress. Instead, it is able to spend whatever it wants out of the very large profits it automatically makes by issuing money, both the printed and the bookkeeping varieties. On the money-issuing and the spending, there is no constraint except its own decisions.
The more independent the Fed is, combined with its power and the huge riskiness of its actions, the bigger an institutional puzzle it represents in a government that was built on the principle of checks and balances.
In the famous conclusion of The General Theory of Employment, Interest, and Money (1936), John Maynard Keynes tells us that “soon or late, it is ideas . . . which are dangerous for good or evil.” This is true in general in human affairs, but it is especially true of the ideas that come, from time to time, to dominate the minds of central bankers—and most importantly, the central bankers who run the Fed. Conti-Brown’s tracing of the ideas of the Fed’s dominant personalities over time is key to understanding the institution.
For example, take the idea of fiat money. This was clearly not what the Fed would be about, in the minds of the authors of the Federal Reserve Act, like then-Chairman of the House Banking Committee, Carter Glass (D-Va.). Conti-Brown writes: “The claim that the new Federal Reserve Notes would represent ‘fiat money’ were fighting words.” He quotes Glass’s defense on the floor of the House of Representatives against the charge: “Fiat money! Why, sir, never since the world began was there such a perversion of terms.” But now the Fed is known by all to be the center and font of the worldwide fiat money system.
Or take inflation. Conti-Brown nicely summarizes the view of William McChesney Martin, Chairman of the Fed for 19 years and under five U.S. Presidents in the 1950s and 1960s: “The keeper of the currency is the one who has to enforce the commitment not to steal money through inflation.” But now the Fed has decided to commit itself to perpetual inflation and has for seven years been stealing money from savers through negative real interest rates—all for the greater good as embodied in its current theories and beliefs.
As Conti-Brown says, it is not the case that there are “objectively correct answers to problems of monetary policy . . . in a democracy.” That is why the Money Question, as impassioned historical debates called it, is always political and not merely technical. Central banking is, he writes, “plagued by uncertainty, model failures, imperfect data, and even central banker ideology.” (He should have left out that “even.”)
Conti-Brown views central bankers as “adjudicating between conflicting views of that uncertainty, those failures, these ideologies.” Quite right, except that he has a more optimistic view of the process than I do. In place of “adjudicating” among uncertainties, a more accurate term would be “guessing.”
This recalls a marvelous letter to the Financial Times of several years ago suggesting that “in mathematics, one answer is right; in literature, all answers are right; and in economics, no answers are right.” Conti-Brown says “it is tempting to throw out the entire enterprise of central banking as politics by another name.” But as he also says, this would not be right, either.
The key fact is that in central banking the uncertainty is high and, therefore, guessing is required. But the cost of mistakes can be enormous. This causes responsible minds to tend to cluster around common ideas and to reinforce each other by saying the same things. The book discusses this clustering in terms of “cognitive capture,” but I think a better description would be “cognitive herding.” This affects central bankers as it does everybody else when confronted with the need to decide and act in the face of ineluctable uncertainty.
In making decisions subject to uncertainty, metaphors are helpful, and Conti-Brown is fond of what he calls “the poetry of central banking”—that is, powerful figures of speech. The most famous such metaphor is that of Chairman Martin, who characterized the Fed as the “chaperone who has ordered the punch bowl removed just when the party was really warming up.” Martin (who studied English and Latin at Yale) “changed the language of central banking,” says Conti-Brown, and therefore its ideas. One can only imagine how surprised Martin would be that, in recent years, the chaperone has been the one pouring bottles of rum into the punch bowl to liven up the party.
Finally, on the subject of the Fed’s independence, Conti-Brown quotes Fed Chairman Ben Bernanke telling his successor, Janet Yellen, that “Congress is our boss.” But does the Fed as an institution really accept that as it insistently defends and pursues its independence? The more the Fed achieves practical independence from Congress, the more intriguingly alien to our fundamental Constitutional order it is.
Puerto Rico: A big default—what next?
Published in the Library Of Law And Liberty.
Rexford Tugwell, sometimes known as “Rex the Red” for his admiration of the 1930s Soviet Union and his fervent belief in central planning, was made governor of Puerto Rico by President Franklin Roosevelt in 1941. Among the results of his theories was the Government Development Bank of Puerto Rico, a bank designed as “an arm of the state,” which is a central element in the complicated inner workings of the Puerto Rican government’s massive insolvency.
The bank has just defaulted on $367 million of bonds – the first, but unless there is congressional action, not the last, massive default by the Puerto Rican government and its agencies on their debt. The Government Development Bank was judged insolvent in an examination last year, but the finding was kept secret. The governor of Puerto Rico has declared a “moratorium” on the bank’s debt, which means a default. A broke New York City in 1975 also defaulted and called it a “moratorium.”
Adding together the Puerto Rican government’s explicit debt of about $71 billion and its unfunded pension liabilities of about $44 billion amounts to $115 billion. This is six times the $18 billion in bonds and pension debt of the City of Detroit, which holds the high honor of being the largest municipal bankruptcy ever.
Puerto Rico’s government-centric political economy goes back to Rex the Red, but its budget problems are also long-standing. In this century, the government has run a deficit every year, borrowed to pay current expenses, and then borrowed more to service previous debt until the lenders belatedly ceased lending and the music stopped. Its debt and its real gross domestic product definitively parted company in 2001 and have grown continuously further apart, as shown Graph 1.
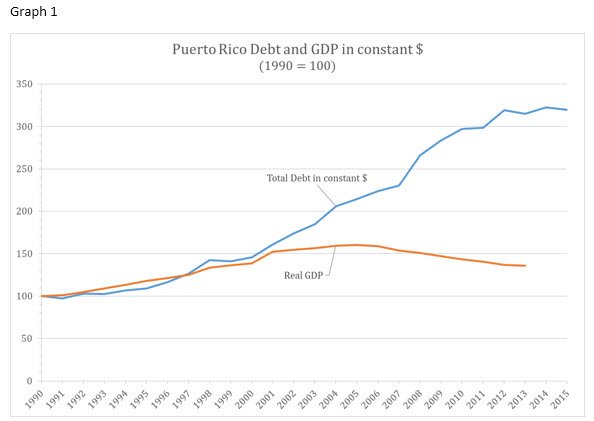
As its debt skyrocketed, the credit ratings of its bonds fell and then crashed. See Graph 2.
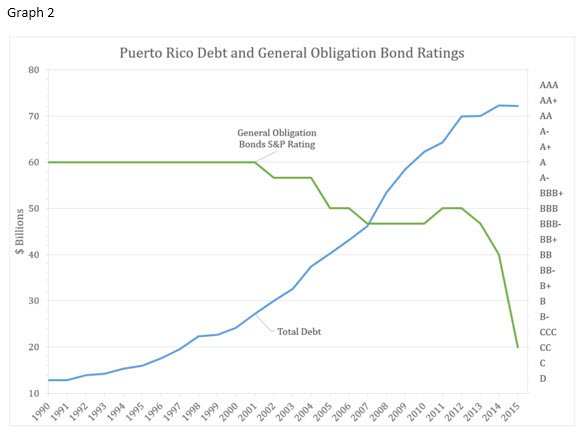
Where do we go from here? Addressing the deep, complicated, and contentious problems requires three steps:
The creation of an emergency financial control board to assume oversight and control of the financial operations of the government of Puerto Rico, which has displayed incompetence in fiscal management (or mismanagement), is a central aspect of the solution. This control board can be modeled on those successfully employed to address the insolvencies and financial mismanagement in the District of Columbia in the 1990s, in New York City in the 1970s and in numerous other places. More recently, the City of Detroit got an emergency manager along the same lines.
Such a board would be and must be quite powerful. The sine qua non for financial reform is to establish independent, credible authority over all books and records; to determine the true extent of the insolvency of the many indebted government entities—in particular to get on top of the real condition of the Government Development Bank; and to develop fiscal, accounting, control and structural reforms which will lead to future balanced budgets and control of the level of debt.
Needed reforms cited by Puerto Rican economist Sergio Marxuach in congressional testimony include:
[I]ncrease tax revenues by improving enforcement efforts, closing down ineffective tax loopholes, and modernizing its property tax system; crackdown on government corruption; significantly improve its Byzantine and unduly opaque financial reporting; reform an unnecessarily complicated permitting and licensing system that stifles innovation; … lower energy and other costs of doing business.
That’s a good list of projects.
Does all this take power and responsibility away from the Puerto Rican government? Of course it does – it needs to and it can be done. Under the Constitution, Congress has complete jurisdiction over territories like Puerto Rico. Just as in Washington and New York City, when the problems are straightened out, financial management will revert to the normal local government.
Pollock’s Law of Finance states that “Loans which cannot be repaid, will not be repaid.” Naturally, this law applies to the $115 billion owed by the Puerto Rican government, which is on its way to some form of restructuring and reorganization of debts. It seems clear that this should be done in a controlled, orderly and equitable process, which takes into account the various levels of seniority and standing among the many different classes of creditors.
The pending House bill puts the proposed oversight board in the middle of the analysis and negotiations of competing claims. If the reorganization cannot be voluntarily agreed upon, the process can move to the federal court, where the plan of reorganization would come from the oversight board.
Three objections have been made to this approach. One that has been advertised heavily claims that it is a “bailout.” Since no taxpayer money is planned to go to creditors, this is simply wrong and ridiculous. Bondholders taking losses is the opposite of a bailout.
A second is that bondholders may be disadvantaged versus pension claims, and this may affect the whole municipal bond market. Indeed, in the Detroit bankruptcy, the general obligation bonds got 74 cents on the dollar, while the general city employee pensions got 82 cents— an important haircut, but a smaller one. The political force of pension claims in insolvencies is a credit fact that all investors must take into account. If the national municipal bond market internalizes and prices the risks of unfunded pensions, thereby bringing more discipline on the borrowers, that seems like progress to me.
A third objection is that the bill’s approach would set a precedent for financially struggling states like Illinois, which they might follow. In my judgment, there is zero probability that Illinois or any other state would volunteer to have a financial control board imposed on it. Even leaving aside the fact that Puerto Rico is not a state, this argument is vacuous.
Of fundamental importance is that in the medium term, Puerto Rico must develop a sustainable economy—that is, a market economy to replace its historically government-centric one. Various ideas have been proposed relevant to this essential goal, and much more work is required. This is the most challenging of all the elements of the problem. Steps 1 and 2 must be done first, but Step 3 must be achieved for ongoing success.
One thoughtful investor in municipal bonds, reflecting on Puerto Rico, Illinois and other troubled political entities, concluded, “We don’t trust governments.” That made me think of how there have been more than 180 defaults and restructurings of sovereign debt in the last 100 years and how, further back, a number of American states defaulted on their debts and even repudiated them. So I wrote him, “I think that’s wise.”
Nonetheless, the immediate requirement to deal with the Puerto Rican debt crisis is government action.