In tracking homeownership, marriage matters
Published in Real Clear Policy with Jay Brinkmann.
Homeownership long has been considered a key metric for economic well-being in the United States. Thus, many are dismayed by the fact that, at 63.5 percent, the 2015 overall homeownership rate appears to be lower than the 64.3 percent of 1985, a generation ago. But viewed in another, arguably more relevant way, the underlying trend shows the homeownership rate is, in fact, increasing, not decreasing.
How so? Key to the trend is the extremely strong relationship between marriage and homeownership — a relationship seldom, if ever, addressed in housing-finance discussions. But if you think about it, it’s obvious that homeownership should be higher among married couples than among other households; in fact, it’s remarkably higher.
This relationship holds across all demographic groups. Importantly, it means that changes in the proportion of married versus not-married households is a major driver of changes in the overall homeownership rate over time. Homeownership comparisons among demographic groups are similarly influenced by differences in their respective proportions of married versus not-married households.
Policy discussions over falling homeownership rates frequently ignore some critical underlying demographic facts.
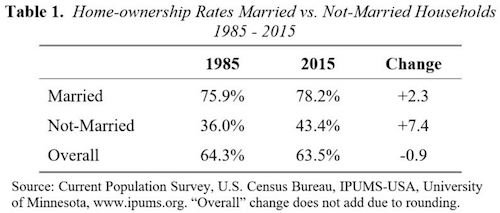
The current 63.5 percent American homeownership rate combines two very different components: married households, with about 78 percent homeownership, and not-married households, with only 43 percent homeownership. Married households have a homeownership rate 1.8 times higher — obviously a big difference. (As we have organized the data, these two categories comprise all households: “married” means married with spouses present or widowed; “Not-married” means never married, divorced, separated or spouse absent.)
Table 1 contrasts homeownership by married versus not-married households, showing how these homeownership rates have changed since 1985.
One is immediately struck by a seeming paradox:
The homeownership rate for married households has gone up by 2.3 percentage points.
The homeownership rate for not-married households has gone up even more, by 7.4 percentage points.
But the overall homeownership rate has gone down.
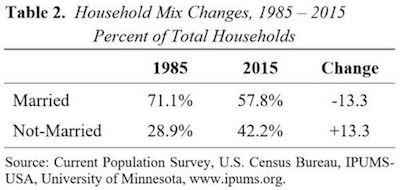
How is this possible? The answer is that the overall homeownership rate has fallen because the percentage of not-married households has dramatically increased over these three decades. Correspondingly, married households (which have a higher homeownership rate) are now a smaller proportion of the total. Still, homeownership rose for both component parts. So the analysis of the two parts gives a truer picture of the underlying rising trend.
The dramatic shift in household mix is shown in Table 2.
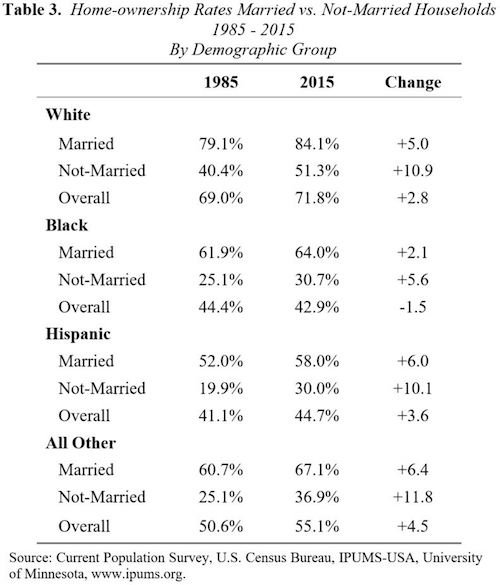
Table 3 shows that the strong contrast between married and not-married homeownership rates and related changes from 1985-2015 hold for each demographic group we examined.
That is, homeownership for both married and not-married households went up significantly for all four demographic groups from 1985 to 2015.
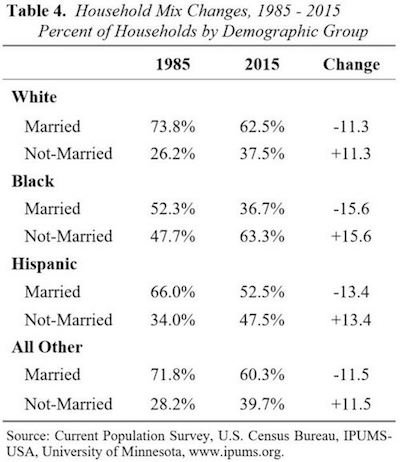
Moreover, overall homeownership also increased for three of these four groups. Homeownership for black households, meanwhile, fell by 1.5 percentage points, though homeownership for both married and not-married components rose for this demographic as well. (This is consistent with that group’s showing the biggest shift from married to not-married households.)
In another seeming paradox, Hispanic homeownership rates rose, while still contributing to a reduction in the overall U.S. rate. The reason for this is that their share of the population more than doubled, increasing the weight of their relatively high share of not-married households.
The trends by group in the mix of married versus not-married households are shown in Table 4.
What would the U.S. homeownership rate be if the proportions of married and not-married households were the same as in 1985? Applying the 2015 homeownership rates for married and not-married households to the mix that existed in 1985 results in a pro forma U.S. homeownership rate of 68.1 percent. This would be significantly greater than both the 1985 level of 64.3 percent and the 2015 measured level of 63.5 percent.
Adjusting for the changing mix of married versus not-married households gives policymakers a better understanding of the underlying trends. This improved understanding is particularly important when weaker credit standards are proposed as a government solution to the lower overall homeownership rate.
To make sense of homeownership rates, we have to consider changes in the mix of married versus not-married households. And these changes have been dramatic over the last 30 years.


