
Tags
Financial Systemic Issues: Booms and Busts - Central Banking and Money - Corporate Governance - Cryptocurrencies - Government and Bureaucracy - Inflation - Long-term Economics - Risk and Uncertainty - Retirement Finance
Financial Markets: Banking - Banking Politics - Housing Finance - Municipal Finance - Sovereign Debt - Student Loans
Categories
Blogs - Books - Op-eds - Letters to the editor - Policy papers and research - Testimony to Congress - Podcasts - Event videos - Media quotes - Poetry
A Calm Analysis of the Panic of 2008
Published in Law & Liberty.
It makes sense that the 2008 bailouts inspired a lot of emotion, rhetoric, and hyperbole. Hundreds of billions of dollars had just been lost, the government was rescuing arguably undeserving institutions and their creditors, and the financial system seemed to be wavering on the edge of an abyss. Sixteen years after the panic, though, Todd Sheets manages to stay calm, analytical, and generally convincing in his new book discussing the Great Housing Bubble, its causes, its acceleration, its collapse, and the costly aftermath. 2008: What Really Happened dispassionately reviews the actions of key parts of the US government that were central to creating each stage of the bubble and bust over a decade.
In the early 2000s, Sheets tells us, he “had a growing concern that the Fed’s cheap-money policies were destined to end badly.” Then came the first financial crisis of the then-new twenty-first century. This disaster, we should remember, arrived shortly after we were assured by leading central bankers that we had landed safely in a new age of “The Great Moderation.” In fact, we landed in a great overleveraged price collapse.
In economics, the future is unknowable, we are usually confused by the present, and we can easily misinterpret the past. Sheets believes that “historical review reveals … a lengthy delay from an economic crisis to an understanding of what really happened.” He tells us that the book is a result of deciding, while reflecting on the crisis, that “I was confused about big-picture economic matters I had long taken for granted and realized it was time for a new self-study program … focused on financial history.”
Five Phases of the Bubble
Sheets’ study has resulted in an instructive historical framework for understanding the development from growing boom to colossal bust. He proposes five principal stages:
1. The pre-Bubble era, pre-1998: This era is now 26 years, or a whole generation, away from today. Sheets emphasizes the long historical period when average house price increases approximately tracked general inflation. “In the century preceding the housing bubble, house prices more or less tracked inflation,” he writes, “increases in real house prices were negligible.” He believes this is historical normalcy. One might argue that the average real increase in US house prices had been more like 1 percent per year (as I did at the time in graphing the Bubble’s departure from the trend), but that does not alter the fundamental shift involved.
2. Liftoff, 1998–2001: “Beginning in 1998, housing prices suddenly departed from these long-term historical trends,” Sheets notes. In other words, the Bubble starts inflating ten years before the final panic. “Real home prices suddenly begin to increase at an average annual rate of 4.7% during Liftoff.” Why did they? We will discuss below Sheets’ proposals for the principal cause of each phase.
3. Acceleration, 2002–2005: In this phase, “the rate of real home price appreciation began to accelerate even more rapidly”—it “shot up again, to an average annual rate of 8.3%, reaching a peak of 10.4% in 2005.” Remember that Sheets is always dealing always in real price increases—those on top of the general rate of inflation. At this point, it seemed to many people that buying houses with the maximum amount of mortgage debt was a sure-fire winning bet. From 1998 to 2006, Sheets calculates that in real terms, house prices “appreciated over 10 X the level of cumulative appreciation in the 100 years before the bubble.”
4. Deceleration, 2006: “The rate of increase in real house prices slowed dramatically” in the transition year of the inflation turning into deflation of the bubble.
5. Crash, 2007-2012: Home mortgage debt had by now become much more important to the US economy than before, surging strikingly, as Sheet’s table of mortgage debt as a percent of GDP shows:

A lot of people had made a lot of money on the way up, but any potential mortgage debt losses now had a much bigger potential negative impact than before. How much bigger? We were about to discover. Then, “beginning in 2007, real house prices declined … eventually falling about one-third.” Indeed, house prices fell for six years, until 2012. Between 1998 and 2012 we thus approximated the biblical seven fat years followed by seven lean years. There were vast losses to go around, defaults, failures, continuing bad surprises, and a constant cry for government bailouts, as inevitably happens in financial crises.
Sheets helpfully divides Phase 5, the Crash, into four component stages. For many of us, he reenergizes memories that may have been fading by now, and for those younger without the memories, provides a concise primer. Thus:
5(a) Awareness, June 2007-October 2007: “Hedge funds managed by Bear Stearns and BNP Paribas that were heavily concentrated in US home mortgages announced significant write-downs.” Oh-oh, but there was still much uncertainty about the implications for wider problems. “The markets still had no idea of just how precipitously housing prices would fall.” The Federal Reserve embarrassingly and mistakenly opined that the problems were “contained.” The stock market rose until October 2007. Showing some earlier awareness of looming problems, in March 2007 the American Enterprise Institute had a conference on “Implications of a Deflating Bubble,” which I chaired. We were pessimistic, but not pessimistic enough.
5(b) Stress, November 2007-August 2008: “A steady procession of substantial mortgage-related write-downs and losses were announced by a wide swath of financial institutions.” Two of my own favorite quotations from this time epitomize the growing chaos. “Hank,” the chairman of Goldman Sachs told the Secretary of the Treasury, Henry Paulson, “it is worse than any of us imagined.” And as Paulson himself summed it up: “We had no choice but to fly by the seat of our pants, making it up as we went along.”
In July 2008, “the Fed invoked special emergency provisions that enabled it to supply bailout financing” to Fannie Mae and Freddie Mac, the dominant mortgage companies. Fannie and Freddie are called “GSEs,” or government-sponsored enterprises. Their creditors believed, even though the government denied it, that “government-sponsored” really meant “government-guaranteed.” The creditors were correct. In the same July, “President Bush signed a bipartisan measure to provide additional funds” to Fannie and Freddie. These two former titans of the mortgage market, the global bond market, and US politics were tottering. But Sheets stresses a key idea: “Markets found additional reassurance in the idea that federal authorities would continue to intervene,” as they did when Fannie and Freddie went broke but were supported by the US Treasury in early September. In a financial crisis, the universal cry becomes “Give me a government guarantee!”
5(c) Panic, September 2008-February 2009: The Treasury and the Fed provided government guarantees and bailed out the creditors of Bear Stearns, Fannie Mae, and Freddie Mac. But on September 15, 2008, “the authorities unexpectedly allowed Lehman Brothers to fail.” Whereupon “the money markets lurched into a state of panic,” their confidence in bailouts punctured. As Sheets relates, this was followed by a series of additional, giant government guarantees and bailouts to try to stem the panic.
5(d) Recovery, March 2009-forward: “What the [panicked] short-term financing markets were looking for,” Sheets concludes, “was unconditional assurance that none of the remaining critical institutions—Citigroup, Merrill Lynch, or Bank of America—would become the next ‘Lehman surprise.’ The final bailout package for these critical institutions was announced in mid-January of 2009.” In 2009 bank funding markets stabilized and the stock market recovered. That is where Sheets’ history concludes, but we should remember that house prices did not finally stop falling until 2012, and the Fed’s abnormally low interest rates resulting from the Crash continued for another decade—through the financial crisis of 2020 and until 2022. But that is another story.
What were the fundamental causes of the ten-year drama of the housing bubble and its end in disaster? “A plausible theory of causation must explain the sudden onset and the distinct phases of the bubble,” Sheets sensibly argues, thus that different phases had different main causes. As he identifies the principal cause of each phase, it turns out that the US government, in various manifestations, is the prime culprit.
“The Liftoff phase of the bubble in 1998 was triggered by the rapid expansion undertaken by Fannie Mae and Freddie Mac,” Sheets concludes. The timing fits: “The sudden acceleration of GSE growth coincided with the onset of the housing bubble.” And the magnitudes: “88% of the excess growth in mortgages outstanding relative to the Base Period originated from the GSEs.”
Fannie and Freddie could have so much impact because they were the dominant competitors, had key advantages granted by the Congress, had deep political influence and allies—but most importantly—operated with a government guarantee. This was only “perceived” and “implied” it was said, but it was nonetheless entirely real. That enabled their debt obligations to be sold readily around the world, as they set out to and did expand rapidly, notably in riskier types of mortgages, seeking political favor as well as more business.
Fannie and Freddie’s rapid expansion was linked to the push of the Clinton Administration to expand homeownership through “innovative” (i.e. risky) mortgages. This was a perfect combination of factors to launch a housing bubble. Sheets correctly observes that Fannie and Freddie’s role was “aided and abetted by federal housing policy.”
He sympathetically discusses Franklin Raines, Fannie’s CEO from 1999–2004, whose “move back to Fannie Mae coincided almost exactly with the onset of the housing bubble.” This section should also have considered James Johnson, CEO from 1991–1998, the real architect of Fannie’s risky, politicized expansion. Both of them combined politics at the highest level in the Democratic Party with housing finance, a combination which produced, as Sheets says, “just the opposite of what was intended.”
Sheets’ conclusions are consistent with those of Peter Wallison’s exhaustive study, Hidden in Plain Sight, which states, “There is compelling evidence that the financial crisis was the result of the government’s own housing policies.” So that no one misses the point, Sheets reiterates, “We can safely conclude that the Liftoff phase of the housing bubble was caused by the GSEs, with the support of the federal government.”
In the acceleration phase, Sheets writes that “the Federal Reserve became the driving force behind the further escalation of real housing price appreciation” by suppressing interest rates to extremely low levels, including negative real interest rates. This made mortgage borrowing seem much cheaper, especially as borrowers shifted to adjustable-rate mortgages.
“The Fed dramatically lowered short-term interest rates in order to deal with the collapse of the Internet stock bubble in 2000 and then held rates at historically low levels. … The Fed pushed the real fed funds rate down to an average of minus 0.6% during the Acceleration phase.” And “Where did the stimulus go? Into housing.”
Sheets notes that after the Internet stock bubble burst in 2000, the Fed lowered short-term interest rates and held them at historic lows. That stimulus, he says, went into housing. I call this the “Greenspan Gamble,” after the famous Fed chairman of the time, who was then admired as “the Maestro” for his timely monetary expansions. As Sheets says, the Fed ended up with the housing bubble instead—which cost Greenspan his “Maestro” title.
After the Fed started increasing rates again in 2005–2006, the housing bubble decelerated, and then collapsed in 2007. House prices started to go down instead of up, the start of the six-year fall. Subprime mortgage defaults went up. Specialized subprime mortgage lenders went broke. The problems spread to leading, household-name financial institutions. In the fourth quarter of 2007, “Citigroup, Bank of America, and Wachovia announced steep profit declines due to mortgage write-downs, … Merrill Lynch announced the largest quarterly loss in the firm’s history, … Citigroup revealed [huge] pending write-downs … [and there was] the steady drumbeat of massive mortgage write-downs, historic losses, and jettisoned CEOs”—all this showed the bust had arrived, just as it had so many times before in financial history, and it kept getting worse.
When Fannie and Freddie went down in September 2008, it provided an affirmative answer to the prescient question posed by Thomas Stanton way back in his 1991 book, A State of Risk: “Will government-sponsored enterprises be the next financial crisis?” That took the crash to the brink of its panic stage. As discussed above, the panic began when the funding market’s expectation that Lehman Brothers would be bailed out by the government was surprisingly disappointed. Peak fear with peak bailouts followed.
Sheets believes this no-bailout decision for Lehman was a colossal mistake, describing the date of Lehman’s bankruptcy as “a day that will forever live in financial infamy.” He provides a summary of internal government debates leading up to the failure, considers the argument that the Treasury and the Fed had no authority to provide a bailout, and finds it unconvincing: “I believe that they could have chosen to bail out Lehman if given sufficient political backing, and that such a step would have averted the Panic stage of the crisis.”
Wallison relates that the decision seems to have originated as a negotiating position of Treasury Secretary Henry Paulsen, who explained that he thought “we should emphasize publicly that there could be no government money … this was the only way to get the best price.” Paulsen also “declared that he didn’t want to be known as ‘Mr. Bailout.’” Wallison is a former general counsel of the Treasury Department and thinks, like Sheets, that authority to rescue Lehman was available: “Paulsen and [Fed chairman] Bernanke … telling the media and Congress that the government didn’t have the legal authority to rescue Lehman … was false.”
What would have followed if there had been a bailout of Lehman, since the deflation of the housing bubble would still have continued? That is a great counterfactual issue for speculation.
2008: What Really Happened ends a good read with two radical thoughts about politically privileged institutions:
Given the understanding of the bubble set forth here, the keys to preventing a similar crisis in the future are relatively straightforward: Eliminate the role of the GSEs in the national housing markets. Eliminate or dramatically curtail the ability of the Federal Reserve to inflate asset bubbles.
Great proposals, with which I fully agree. But Sheets, like the rest of us, does not expect them ever to happen, so he does expect, and so do I, that we will get more bubbles and busts.
The Great Pretenders
It is 50 years ago Wednesday that economist Friedrich Hayek accepts his Nobel Prize with a warning about economists.
Published in The New York Sun.
It will be 50 years on Wednesday since economist Friedrich Hayek’s Nobel Prize lecture, “The Pretense of Knowledge,” our Alex Pollock reminds us. That was the speech in which Hayek decried the “accelerating inflation” of the day — and the bitter irony that it had “been brought about by policies which the majority of economists recommended and even urged governments to pursue.” He concluded: “As a profession we have made a mess of things.”
It was of a piece with Hayek’s role as a contrarian in the economics profession that his “brilliant presentation,” Mr. Pollock notes, “explained the inherent limits of economics and the inevitable failure of trying to make it a predictive mathematical science.” Fifty years on, Hayek’s warning “applies particularly to central banks and their yearning to be economic philosopher-kings,” Mr. Pollock adds. Is this anniversary being marked by the pretenders at the Fed?
…
The refusal to consider gold as a factor in monetary deliberations reflects the failure to heed Hayek’s warning of 50 years ago. Mr. Pollock conveys a hope that institutions like the Fed “have taken to heart Hayek’s lesson that the ‘insuperable limits to knowledge’ ought to teach humility.” Central bankers, in Mr. Pollock’s telling, have reason to be “skeptical about their own forced guessing.” Yet if there is one thing that is in short supply at the Fed, it’s humility.
Causes of the Great Depression
Published in Law & Liberty.
About every ten years or so, financial crises spoil economic hopes and many best-laid plans. As scary as they are while happening, like everything else, in time, they tend to fade from memory. For example, can you recall the remarkable number of US depository institutions that failed in the crisis of the 1980s? (The correct answer: More than 2,800!)
The weakness of financial memory is one reason for recurring over-optimism, financial fragility, and new crises. But the Great Depression of the 1930s is an exception. It was such a searing experience that it retains its hold on economic thought almost a century after it began and more than 90 years after its US trough in 1933. That year featured the temporary shutdown of the entire US banking system and an unemployment rate as high as 24.9 percent. More than 9,000 US banks failed from 1929–33. Huge numbers of home and farm mortgages were in default, and 37 cities and three states defaulted on their debt. How could all this happen? That is still an essential question, with competing answers.
This collection of Ben Bernanke’s scholarly articles on the economics of the Depression was originally published in 2000. That was two years before he became a Governor on the Federal Reserve Board, and seven years before, as Federal Reserve Chairman, he played a starring world role in the Great (or Global) Financial Crisis of 2007–09 and its aftermath, always cited as “the worst financial crisis since the Great Depression.”
Bernanke’s Essays on the Great Depression has now been republished, with the addition of his Lecture, “Banking, Credit and Economic Fluctuations,” delivered upon winning the Nobel Prize in Economics in 2022. They make an interesting, if dense and academic, read.
“To understand the Great Depression is the Holy Grail of macroeconomics,” is the first line of the first article of this collection. “Not only did the Depression give birth to macroeconomics as a distinct field of study, but … the worldwide economic collapse of the 1930s remains a fascinating intellectual challenge.” Indeed it does.
Bernanke points out that “no account of the Great Depression would be complete without an explanation of the worldwide nature of the event.” As one example of this, we may note that Germany was then the second largest economy in the world, and “the collapse of the biggest German banks in July 1931 represents an essential element in the history,” as a study of that year relates. Germany was at the center of ongoing disputes about the attempted financial settlements of the Great War (or as we say, World War I). Widespread defaults on the intergovernmental debts resulting from the war also marked the early 1930s.
“What produced the world depression of 1929 and why was it so widespread, so deep, so long?” similarly asked the eminent financial historian, Charles Kindleberger. “Was it caused by real or monetary factors?” Was it “a consequence of deliberate and misguided monetary policy on the part of the US Federal Reserve Board, or were its origins complex and international, involving both financial and real factors?”
“Explaining the depth, persistence, and global scope of the Great Depression,” Bernanke reflects in his 2022 Lecture, “continues to challenge macroeconomists.” Although he concludes that “much progress has been made,” still, after nearly a century, things remain debatable. This calls into question how much science there is in economics looking backward, just as the poor record of economic forecasting questions whether there is much science in its attempts to look forward.
In economics, it seems, we can’t know the future, we are confused by the present, and we can’t agree on the past. Those living during the Depression were confused by their situation, just as we are now by ours. As Bernanke writes, “The evidence overall supports the view that the deflation was largely unanticipated, and indeed that forecasters and businesspeople in the early 1930s remained optimistic that recovery and the end of deflation were imminent.”
In Lessons from the Great Depression, a 1989 book that Bernanke often references, Peter Temin provides this wise perspective: “We therefore should be humble in our approach to macroeconomic policy. The economic authorities of the late 1920s had no doubt that their model of the economy was correct”—as they headed into deep disaster. “It is not given to us to know how future generations will understand the economic relations that govern how we live. We should strive to be open to alternative interpretations.”
Bernanke considers at length two alternative causes of the Depression and through his work adds a third.
The first is the famous Monetarist explanation of Federal Reserve culpability, referred to by Kindleberger, derived from the celebrated Monetary History of the United States by Milton Friedman and Anna Schwartz. Friedman and Schwartz, writes Bernanke, “saw the response of the Federal Reserve as perverse, or at least inadequate. In their view, the Fed could have ameliorated the deflationary pressures of the early 1930s through sustained monetary expansion but chose not to.” About this theory, Bernanke says, “I find it persuasive in many respects.” However, “it is difficult to defend the strict monetarist view that declines in the money stock were the only reason for the Depression, although … monetary forces were a contributing factor.” It seems eminently reasonable that multiple causes were at work to cause such a stupendously disastrous outcome.
“The Germans kept wages low and reached full employment quickly; the Americans raised wages and had to cope with continued unemployment.”
A second approach takes as central to the depth of the Depression the effects of governments’ clinging too long to the Gold Exchange Standard. That was the revised version of the gold standard that was put together in the 1920s as the world tried to return to something like the pre-Great War monetary system, which previously had accompanied such impressive advances in economic growth and prosperity. The Classic Gold Standard was destroyed by the Great War, as governments bankrupted themselves, then printed the money to spend on the war’s vast destruction and set off the rampant inflations and hyper-inflations that followed.
After the inflations, there was no simple going back to the monetary status quo ante bellum. However, “the gold standard [was] laboriously reconstructed after the war,” Bernanke relates, referring to the Gold Exchange Standard. “By 1929 the gold standard was virtually universal among market economies. … The reconstruction of the gold standard was hailed as a major diplomatic achievement, an essential step toward restoring monetary and financial conditions—which were turbulent during the 1920s—to … relative tranquility.”
Financial history is full of ironies. Here we had a “major diplomatic achievement” in global finance by intelligent and well-intentioned experts. But “instead of a new era of tranquility,” Bernanke tells us, “by 1931 financial panics and exchange rate crises were rampant, and a majority of countries left gold in that year. A complete collapse of the system occurred in 1936.” The United States left the gold standard in 1933.
Bernanke highlights the comparative studies of countries during the 1930s which found a notable pattern of “clear divergence”: “the gold standard countries suffered substantially more severe contractions,” and “countries leaving gold recovered substantially more rapidly and vigorously than those who did not,” and “the defense of gold standard parities added to the deflationary pressure.” Thus, he concludes, “the evidence that monetary shocks played a major role in the Great Contraction, and that these shocks were transmitted around the world primarily through the working of the gold standard, is quite compelling.”
So far, we have an explanatory mix of the behavior of central banks faced with huge shocks in the context of the revised Gold Exchange Standard in the aftermath of the runaway inflations stemming from the Great War.
In addition, Bernanke’s own work emphasizes the role of credit contractions, not just monetary contractions, with a focus on “the disruptive effect of deflation on the financial system”—or in macroeconomic terms, “an important role for financial crises—particularly banking panics—in explaining the link between falling prices and falling output.” Bernanke provides a depressing list of banking crises around the world from 1921 to 1936. This list is nearly four pages long.
Bernanke concludes that “banking panics had an independent macroeconomic effect” and that “stressed credit markets helped drive declines in output and employment during the Depression.” This seems easily believable.
Bernanke’s articles also address employment during the Depression. Although economic conditions significantly improved after 1933, unemployment remained remarkably, perhaps amazingly, high. Continuing through all of the 1930s, it was far worse than in any of the US financial and economic crises since. At the end of 1939, US unemployment was 17.2 percent. At the end of 1940, after two full presidential terms for Franklin Roosevelt and the New Deal, unemployment was still 14.6 percent. Very high unemployment lasted a very long time.
The Depression-era interventions of both the Hoover and the Roosevelt administrations focused on maintaining high real wages. As Bernanke writes, “The New Deal era was a period of general economic growth, set back only by the 1937–38 recession. This economic growth occurred simultaneously with a real wage “push” engineered in part by the government and the unions.” But “how can these two developments be consistent?” Well, economic growth from a low level with a government push for high real wages was accompanied by high and continued unemployment. That doesn’t seem like a surprise.
The New Deal real wage push continued what had begun with President Hoover. The Austrian School economist, Murray Rothbard, says of Hoover in the early Depression years, “No one could accuse him of being slack in inaugurating the vast interventionist program.” He quotes Hoover’s statement in 1932 that wage rates “were maintained until the cost of living had decreased and profits had practically vanished. They are now the highest real wages in the world.” Rothbard rhetorically asks, as we might ask of the 1930s in general, “But was there any causal link between this fact and the highest unemployment rate in American history?” As Temin observes about the 1930s, “the Germans kept wages low and reached full employment quickly; the Americans raised wages and had to cope with continued unemployment.”
Turning to a more general perspective on the source of the Depression, Rothbard observes that “many writers have seen the roots of the Great Depression in the inflation of World War I and of the postwar years.”
Yet more broadly, it has long seemed to me that in addition to the interconnected monetary and credit problems carefully explored in Bernanke’s book, the most fundamental source of the Depression was the Great War itself, and the immense shocks of all kinds created by the destruction it wreaked—destruction of life, of wealth, in economics, in finance, of the Classic Gold Standard, of currencies, in the creation of immense and unpayable debts, and the destruction of political and social structures, of morale, of pre-1914 European civilization.
As Temin asks and answers, “What was the shock that set the system in motion? The shock, I want to argue, was the First World War.”
And giving Bernanke’s Nobel Prize Lecture the last word, “In the case of the Depression, the ultimate source of the losses was the economic and financial damage caused by World War I.”
Can we regulate our way towards financial stability?
Published in the Institute of Economic Affairs:
Here a new book by Alex Pollock and Howard Adler gives the answer. The book is called Surprised Again, and for good reason. Central bankers frequently tell us that they have fixed the problems of stability this time, and then, often quite soon afterwards, they are surprised and another shock comes.
Why is this? However clever they are, the world fools them, and always will. The explanation turns on the difference between risk and uncertainty. Risk is when we know the range of possible outcomes, and the chance of each. There are many such situations about. But there is also uncertainty – when we may not even know the full range of possible outcomes, and we certainly cannot know how likely each is. This important distinction was the subject of a book by Frank Knight in 1921, and was emphasised recently by John Kay and Mervyn King in their Radical Uncertainty.
The distinction is at the heart of another new book by Jon Danielsson, who shows that to stabilise finance we need to think about the system as a whole. In The Illusion of Control he writes that
“The more different the financial institutions that make up the system are and the more the authorities embrace that diversity the more stable the system becomes and the better it performs” (p. 9).
This is an important part of the explanation for the stability of the British banking system in the nineteenth and a good part of the twentieth centuries. The names of banks – Midland Bank, Bank of Scotland, British Linen Bank for example –make one aspect of this diversity clear.
Mises Institute's Alex Pollock explains why economics is not a science
On Chicago’s Morning Answer radio. Listen here.

Letter: Raising a family is economically productive
Published in the Financial Times.
On page 1 of your June 20 edition is a graph which shows women who are “looking after family” as “economically inactive”. What nonsense.
Keeping a household going, raising children and caring for family members is a most productive economic activity — far more productive than, say, marketing cryptocurrencies.
Your mistaken graph is part of the same confusion that thinks cooking in a restaurant is production, but cooking at home isn’t; that working in a day care centre is production, but bringing up your own children isn’t; that growing food to sell is production, but growing your own food isn’t; that painting a room for money is production, but painting your own room isn’t. It’s a pretty silly conceptual mistake. The Financial Times apparently has forgotten that the root meaning of “economics” in Greek is “management of a household.”
Alex J Pollock
Senior Fellow, Mises Institute
Lake Forest, IL, US
Also cited in a following letter:
Letter: At last some recognition for the housewife
In response to the letter by Alex J Pollock (“Raising a family is economically productive”, June 27) I say “hear, hear” and “thank you”!
At last, women who’ve been or are full-time housewives for years are being given recognition as being valuable contributors to the economics of everyday life.
It seems we have saved the “breadwinners” a fortune by rearing the children, doing the cooking, the gardening, painting, walking the dogs, doing the laundry and being a chauffeur.
We also have the time to help with non-profit-making activities in the community. I remember a quote from the late Anita Roddick: “If a woman can run a home, she can run a business”.
It’s a good life too; we are our own bosses, every day is different and it’s up to us to use our free time well.
Sarah Tilson
Kilternan, Ireland
Are Remote Workers More Productive? We Finally Have the Answer
Published in FOND.
Productivity is typically measured by an individual’s output vs. input over a period of time. One example of this is gross domestic product (GDP) per worker, which measures output by person over the course of a year. However, the ways in which we measure productivity today are much more complex.
The golden 2% has created the modern world
Published in Financial Times.
Of course Vaclav Smil is correct that Moore’s Law-type growth rates of 35 per cent per year will not go on forever, however astonishing the record so far (“Infinite growth is a pipe dream”, August 9). But how about 2 per cent? Professor Smil turns up his nose at a growth rate of a mere 2 per cent real per capita per year. Yet that very 2 per cent continued over long times is the true miracle that has created the modern world. At 2 per cent compounded, in a century, people are on average seven times economically better off. So we ordinary people are seven times better off than our ancestors were as Woodrow Wilson et al negotiated the Treaty of Versailles in 1919.
This is amazing. Can we imagine that people in 2119 will again be on average seven times better off that we are today? That would be the result of the golden 2 per cent. Whether 2 per cent can continue indefinitely is a far more interesting question than whether 35 per cent can.
Thoughts on the Source of International Economic Advantage
Published in Real Clear Markets.
What are the possible sources of America’s international economic advantages and success at creating a superior standard of living for its people? Each fundamental factor of production gives rise to a potential competitive advantage. According to the classic list of Adam Smith, these factors are Land, Labor and Capital. A more compete list would contain five fundamental factors:
1. Natural Resources
2. Labor
3. Capital
4. Knowledge
5. Social Infrastructure.
In the revised list, Natural Resources is a more general version of Land. Labor must be understood to include the essential element of education, as well as a crucial kind of labor: that of the entrepreneur. Capital is what allows risks to be taken and economic growth to accumulate. Knowledge most importantly means science and its offspring, technology of all kinds. Knowledge also includes knowing how to manage large, complex organizations. Social Infrastructure means the laws, property rights, financial practices, enforcement of contracts, culture friendly to enterprise, the lack of stifling or corrupt bureaucracy, and the essential political stability that together allow markets, including financial markets, to function well.
Historically, America had important advantages in all five fundamental factors, leading to its establishment by 1920, a hundred years ago, as the dominant economy in the world. But global development, a very good thing for mankind in general, makes it harder to maintain America’s former advantages. This suggests the U.S. political economy will be continuingly challenged at how to provide higher pay than elsewhere in the world—otherwise known as a higher standard of living. It means we have less room than before for subsidizing political drag.
In the global competition of the ongoing 21st century, America no longer has as great an advantage as it previously did in the first four factors, but a continuing and central advantage in the fifth. This advantage, however, can be weakened by unwise politics and bureaucracy.
Let us consider each of the factors in turn in a globalized world.
1. Natural Resources. Commodities trade actively in world markets, move among countries with very low transportation costs, historically speaking, and are available almost everywhere. Being a natural resources-rich country, as the U.S. is, matters less than before. For example, making Land more productive by the scientific agriculture of the 19th century, as symbolized by the institution of land grant colleges, and by the continuing advances in agricultural science since then, is available everywhere in the world.
2. Labor. The great historical revolution of public education has spread around the world, while the struggles of large parts of U.S. public education are well known. The ability to organize and manage large, capital-intensive enterprises to make labor productive has also spread around the world. Large pools of educated, technically proficient labor are increasingly available, notably in China and India. Napoleon thought China a sleeping giant and recommended not waking it up. Now we have two giants awake, as well as other countries, with increasingly educated labor. If America wants to provide higher pay than they do for work with the same level of education, this must be based on a different fundamental advantage.
3. Capital. Capital is essential to all risk-bearing, economic growth and productivity. Savings available for investment as capital now flow quickly around the world, seeking and finding the best opportunities wherever they may be. While capital is raised and employed in huge amounts in the U.S., we are not the leaders in savings.
4. Knowledge. The incredible economic revolution of the last 250 years, or modernization, which empowered first Britain, then Western Europe and America with vast leadership advantages, has as its most fundamental source science based on mathematics. Scientific Knowledge, turned to technology and harnessed to production by entrepreneurial energy, then matched with learning how to manage large organizations, created the modern world. Mathematical science began as a monopoly of Europe and America, but is now the most cosmopolitan of human achievements. America has world-leading research capabilities, including top research universities, but Knowledge is now available everywhere and incorporated into international scientific endeavor.
5. Social Infrastructure. The political stability, clear property rights and safety of America have long served to attract investment as a safe haven and supported the role of the U.S. dollar as the dominant reserve currency. By designing a stable political order which continued to work for an extremely large republic, the American Founding Fathers also created a powerful economic competitive advantage. This advantage was augmented when Europe destroyed itself in the First World War, and New York replaced London as the center of world capital markets, and when Europe again destroyed itself in the Second World War. This key advantage continues and helps explain how the U.S. can finance its continuous trade and budget deficits. It may be an “exorbitant privilege” as viewed from France, but it is one earned by superior Social Infrastructure.
As John Makin instructively wrote a decade ago, “The fact that global savers accommodate U.S. consumers…is simply a manifestation of America’s competitive advantage at supplying wealth management services.”
This advantage in wealth storage, reflecting an advantage of Social Infrastructure, yields not only economic, but also large political and military benefits. But no competitive strength is incapable of being lost over time, as former world economic leader Britain found out. The strongest advantages can be weakened by political, bureaucratic, legal and regulatory drag. The constant effort to maintain these advantages also maintains the ability to pay more for work than other countries do.
Fixing capitalism
Published in Barron’s.
In “A Radical Proposal for Improving Capitalism” (Other Voices, June 16), Eric A. Posner and E. Glen Weyl repeat the venerable observation of Adolph Berle and Gardiner Means (in The Modern Corporation and Private Property, published in 1932) that in corporations, “ownership was separated from control,” where the shareholders are seen as principals and the management as hired agents. But this is old news.
The fundamental structure of corporations has changed little since 1932, but the structure of capital markets has changed a lot. In addition to the concentration of voting power that Posner and Weyl reasonably worry about, a more fundamental problem is that we now have an additional, dominating layer of agents: the investment managers. The result is a further separation: that of ownership from voting. The hired employees of the investment-management firms control the votes, and claim to be stockholders, but in fact they are merely agents with other people’s money.
What do those other people, the real owners, have to say in contrast to whatever their hired agents may think? Those may not be at all the same. If you don’t like agents being in control in the one case of separation, why would you like them being in control in the other?
The great waves of industrial innovation
Published in Law & Liberty.
How did the world of lord and serf, horse and carriage, superstition and disease, turn into the world of boss and worker, steam and steel, science and medicine?
Jonathan Steinberg asks us to ponder this in his lecture series “European History and European Lives: 1715 to 1914.” We can add to his question, among countless other things previously unimaginable, “and the world of jets and space probes, computers and Google searches, antibiotics and automatic washing machines, and sustained long-term economic growth per capita?” Relative to all previous human life, this new world, the one we live in, is truly astonishing. As Steinberg asks us to wonder, “How and why did what we call the modern world come about?”
The answer at the most fundamental level is through the creation and harnessing of scientific knowledge. Far and away the most important event in all of history was the invention of science based on mathematics by the geniuses of the seventeenth century. This is symbolized above all by Isaac Newton, whose masterwork, Philosophiae Naturalis Principia Mathematica, we may freely render into English as “Understanding Nature on Mathematical Principles.” The invention of mathematicized science was the sine qua non of the modern world. Other important modernizing developments in government, law and philosophy are handmaidens to it.
As Alexander Pope versified the impact:
Nature and Nature’s laws lay hid in night:
God said, Let Newton be! And all was light.
Of course, the translation to the modern world was not quite that direct. The new and multiplying scientific knowledge had to be transferred into technical inventions, those into economically useful innovations, those expanded into business ventures by entrepreneurial enterprise, and with the development of management processes for large-scale organizations, those spread around the world in great waves of industrial innovation.
We may picture these great waves over the last two and a half centuries like this:

Waves of Innovation
The result of these sweeping creations by the advantaged heirs of the Newtonian age is the amazing improvement in the quality of life of ordinary people like you and me. As measured by real GDP per capita, average Americans are about eight times better off than their ancestors of 100 years ago. (They in turn were far better off than their predecessors of the 18th century, when the modern world began to emerge.)
In 1897, average industrial wages per week have been estimated at $8.88. That was for a work week of about 60 hours (say six ten-hour days—and housewives had to work 70 hours a week to keep home life going). The industrial wages translate to 15 cents an hour. Correcting for inflation takes a factor of about 25, so 15 cents then is equivalent to $3.75 today. Current U.S. average hourly manufacturing wages are $21.49, adding benefits gives total hourly pay of over $30. In other words, real industrial hourly pay has multiplied about eight times. While this was happening, over the course of a century a lifetime’s average working time per day fell in half, while average leisure time tripled, according to estimates by Robert Fogel.
Along the way, of course, there were economic cycles, wars, recessions, depressions, revolutions, turmoil, crises, banking panics, muddling through and making mistakes. But the great waves of industrial innovation continued, and so did the improving standard of living on the trend.
Joseph Schumpeter memorably summarized the point of economic growth as not consisting in “providing more silk stockings for queens, but in bringing them within the reach of factory girls in return for steadily decreasing amounts of effort.” The Federal Reserve Bank of Dallas demonstrated how more goods for less effort indeed happened—showing how prices measured in hours and minutes of work at average pay dropped dramatically during the twentieth century. Their study, “Time Well Spent—The Declining Real Cost of Living in America,” is full of interesting details—here are a few notable examples. The time required to earn the price of milk fell 82%; of a market basket of food, 83%; of home electricity, 99%; of a dishwashing machine, 94%; of a new car, 71%; and of coast-to-coast airfare, 96%. Of course, no amount of work in the early twentieth century could have bought you an iPhone, a penicillin shot, a microwave oven, a ride on a jet across the Atlantic Ocean, or a myriad of other innovations.
These advances in the economic well-being of ordinary people are consistent with a famous prediction made by John Maynard Keynes in 1930. In the midst of the great global depression, which might have led to despair about the future, Keynes instead prognosticated that the people of 2030, of 100 years from then, would be on average four to eight times better off due to innovation and economic growth. As 2030 approaches, we can see that his forecast will be triumphantly fulfilled near the top of its range.
How much can the standard of living continue to improve? In 1900, according to Stanley Lebergott, the proportion of Americans who had flush toilets was only 15%. Only 24% had running water, 1% had central heating, 3% had electricity, and 1% owned an automobile. The people of that time could not imagine ordinary life as it is now. Correspondingly, it is exceptionally difficult for us to imagine how hard, risky and toilsome the average life was then.
And if we try to imagine the ordinary life of 100 years into the future, can we think that people will once again be eight times better off than we are? Can the great waves of innovation continue? Julian Simon maintained that since human minds and knowledge constitute “the ultimate resource,” they can. “The past two hundred years brought a great deal of new knowledge relative to all the centuries before that time,” he wrote, “the past one hundred years or even fifty years brought forth more than the preceding one hundred years,” and we can confidently expect the future to continue to “bring forth knowledge that will greatly enhance human life.”
Household incomes can fall even when everyone’s getting richer
Published by the R Street Institute.
One of the politically hottest statistics right now is median household income, especially its slow growth. But there is a big problem with understanding what this statistic means, since it mixes up two different things: the changing composition of households and changes in incomes. If the makeup of households is altering dramatically, as it has in recent decades, median household income may be a quite misleading number.
For example, it is mathematically possible for everyone’s income to be rising, while the median household income is falling. How is that possible? The paradox is caused by counting by households, when the relationship between individuals and households keeps shifting.
To take the simplest possible case: Consider a population of one household, a married couple, each of whom has an income of $50,000. The median household income is $100,000. Their incomes each rise by 10 percent to $55,000—but they get divorced. Now there are two households. The median household income has become $55,000. The median household income has gone down by 45 percent! Obviously, we have a demographic event, not an income event.
Suppose our married couple stays married with their new household income of $110,000. An immigrant joins the population, making $20,000, which is three or four times his previous income. In this case, the median household income has become $65,000, falling 35 percent! But everybody is better off than they were before.
In what is naturally a more complicated way, just these sorts of major changes have been going on inside the statistics that count income by household. If the composition of households were unchanged, the statistics would be more straightforward. But this is obviously not the case. Until the demographic changes are untangled from the results, it’s not clear what the changes in median household income tell us.
GDP per-worker vs. GDP per-capita
Published by the R Street Institute.
We have previously compared the growth in real per-capita gross domestic product between the United States and Japan and among the 10 largest advanced economies. Growth in GDP per-capita measures the increase in the average economic well-being in the country, and adjusts gross GDP growth for whether the population is increasing, stable or declining.
We now shift to comparisons of growth in GDP per-worker (more precisely, per employed person). This addresses productivity, rather than overall economic well-being, and adjusts for shifts in the composition of the population among those who are employed. Those are who not employed include, for example, children, full-time students, retired people, those unemployed and looking for work, those unemployed and not looking for work, and those (especially mothers) who do plenty of work in the home, but not as paid employees.
If the overall population is growing, it’s possible for GDP to grow while GDP per-capita does not. Similarly, if there is a shift within the population toward greater workforce participation, GDP per-capita might grow, while GDP per-worker does not. More generally, the growth rates of these measures of economic performance may be quite different.
Table 1 compares the striking slowdown in economic growth between the last half of the 20th century and the first 15 years of the 21st in the growth of real GDP, both per-capita and per-worker. However, the 21st century slowdown, while marked, is less extreme when measured per-worker (1.82 percent to 1.11 percent) than when measured per-capita (2.25 percent to 0.90 percent). In other words, the productivity slowdown is less than the overall economic welfare deceleration. This reflects demographic changes: from 1959 to 2000, the number of workers grew faster than the population as a whole. In the 21st century, it’s grown more slowly.

How does the United States compare to Japan, when measured in growth in real GDP per-worker? Here our data makes us shift to 1960 to 2014, still a more than 50-year run. The relative growth performance of the two countries flips dramatically between the 20th and 21st centuries, although both are significantly slower, as shown in Table 2. Japan will continue to be an interesting case of a very technically advanced, but rapidly aging economy with falling employment and a falling population going forward.

Seemingly small differences in compound growth rates make for big differences if they continue over time. Table 3 shows the multiple of real GDP per-worker over 50 years in the actual second half of the 20th century, compared to a projection for 50 years of the 21st century if the century’s current trends continue. The result is a drop from an aggregate improvement of 2.5 times, to 1.7 times.

Can the growth in real GDP per-worker reaccelerate or not? That is indeed the question.
Why current asset prices are dangerously exaggerated
Published in Real Clear Markets.
Over the long term, real per-capita household net worth in the United States has grown at about 2 percent a year. This is a wonderful achievement of the enterprising economy.
In shorter periods, when asset prices get inflated in a bubble, household per-capita wealth appears to rise notably above this long-term pace, but ultimately, bubble asset prices inevitably shrivel. When they do, many commentators claim that a lot of “wealth” been lost by households. It hasn’t, because the apparent wealth was not really there in the first place: it was an illusion of the bubble.
If any very great number of people try to sell out at the bubble prices, the evanescent “wealth” disappears, the bubble deflates and the long-term trend reasserts itself, so the aggregate bubble prices can never be realized. Bubble times reflect what Walter Bagehot so truly wrote in 1873: “All people are most credulous when they are most happy.”
Graph 1 is the record of 1953 to 2016. The temporary illusion of wealth represented by two remarkable bubbles of recent decades is obvious.

We should recall with amused irony that the central bankers formerly congratulated themselves for creating what they credulously called “The Great Moderation.” What they actually presided over was the Era of Great Bubbles: first the Great Overpaying for Tech Stocks in the 1990s, then the Great Overleveraging of Real Estate in the 2000s.
And now? They are congratulating themselves again for innovative or radical monetary actions, including their zero interest rate policy (ZIRP), which expropriates the returns to savers and makes the present values of assets rise. Many observers, including me, think they have by their manipulations inflated new bubbles in stocks, bonds and houses. This has put real household wealth per-capita measured at current asset prices back over its 2 percent growth line, although not as egregiously as in the government-promoted housing bubble of the last decade. We can expect ultimate regression to the trend, as always.
But has the trend shifted? From 1950 to 2000, growth in U.S. real per-capita gross domestic product averaged more than 2 percent per-year. This is consistent with a 2 percent growth in wealth per-capita. But since 2000, real per-capita GDP has grown less than 1 percent per-year. Suppose the stagflationists are right, and this represents not a temporary, but a sustained downshift. Then it would be consistent with real per-capita economic growth to move our trend growth in real net worth per-capita down to 1 percent. Graph 2 shows the possible new trend line, starting in 2000.

If we measure from this new line, the current ZIRP bubble looks much worse; it has reached almost the same magnitude as the infamous housing bubble of a decade ago.
Graph 3 shows the variation from the 2 percent and 1 percent lines, displaying the illusory household wealth effects of the series of bubbles in a different fashion.

The more you believe the stagflationist theory, the more you must conclude that current asset prices are dangerously exaggerated, the greater the bubble you must conclude that the central bank experiments have wrought and the further we have to fall back to the trend.
Growth in per-capita GDP: How does the United States rank?
Published by the R Street Institute.
Growth in gross domestic product after adjustment for inflation (real GDP) is the most frequently reported and discussed economic measure. More important, however, is how people on average are doing from an economic standpoint. This means measuring output per person, or real per-capita GDP, and its growth rate.
How does the United States rank among other countries on this growth measure?
In “Japan vs. the U.S. in Per Capita GDP,” we observed that, for the 15 completed years of the 21st century, there is not much difference between average growth in real per-capita GDP between the United States and Japan—the latter often described as suffering from economic stagnation.
Now we expand our comparison to the 10 largest advanced economies in the world. Here they are, ranked by the average growth rate in real per-capita GDP in this century so far:
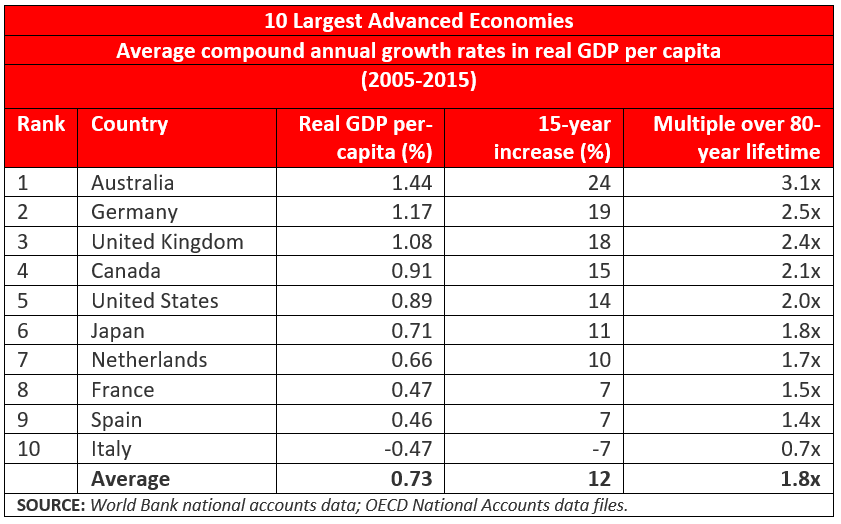
Note that the United States and Japan are together right in the middle of the pack, fifth and sixth, respectively, bracketed by Canada and the Netherlands. Three other countries achieved substantially higher real growth rates when measured per person, and three were substantially lower, including Italy, whose growth rate was negative. Among the 10 countries, the average growth rate was 0.73 percent per year, in between the United States and Japan.
The table also shows how much aggregate difference there is as the growth rate compounds for 15 years. At Australia’s leading 1.44 percent average growth rate, aggregate product per person increased by 24 percent in 15 years. The comparable number for the United States is 14 percent. France and Spain are half that at 7 percent and Italy is a 7 percent decrease.
The effects of differences in compound growth rates are always impressive if they continue over a long time.
We calculate what the aggregate increase in average economic well-being would be if the growth rate in real per-capita GDP could be sustained for a lifetime of 80 years. Australians would become, on average, three times better off during their lives; Canadians, Americans and Japanese about twice as well off. Spaniards would be 40 percent better off. In the long view of the millennia of human history, this is very impressive.
Of course, if the growth rate in real per-capita GDP could be 2 percent, these numbers would be much more impressive yet. Then, in an 80-year lifetime, the average economic standard of living would quintuple.
The new century brings remarkable downshift in per-capita GDP growth
Published in Real Clear Markets.
For the half-century from 1950 to 2000, U.S. real gross domestic product per capita grew at an average rate of 2.22 percent per year. For the first 15 years of the 21st century so far, this key measure of the overall standard of living has grown, on average, at only 0.89 percent.
Of course, a growth rate per person of 0.89 percent is still growth, and growth in output per person sustained over years is still a notable achievement of the market economy.
But the difference between growth rates of something over 2 percent and a little less than 1 percent is a very big deal. How much difference does that drop make, if it continues? Thanks to the always-surprising power of compound growth rates over time, the difference in the resulting long-term standard of living is huge.
In a lifetime of 80 years, for example, per capita GDP growth of 0.89 percent per year will double the economic standard of living-on average, people will become twice as well off as before. But with a growth rate of 2.22 percent, GDP per capita will more than quintuple in the same 80 years-people will be five times as well off. Such amazing improvement has actually happened historically beginning with the economic revolutions of the 19th century and continuing through the 20th. In 1950, U.S. real per capita GDP was $14,886 (using constant 2009 dollars). By 2000, it was $44, 721-thus 3X in 50 years.
The downshift of our new century is apparent when we look at the average growth rates in successive 15-year periods, as shown in the table.
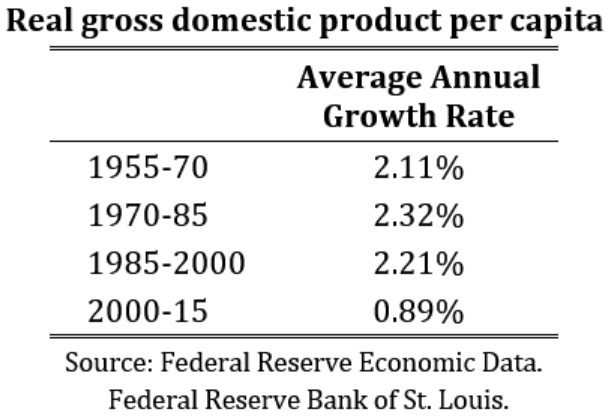
Why the downshift and will it continue? The answer, as with so many things in economics, is that we do not know.
One theory now proposed is “secular stagnation.” This is not really so much a theory as giving a different name to slower growth rates. “Stagnation” was also a noted economic assertion in the 1940s– just before the postwar boom and on the verge of 50 years of solid growth. The great economist, Joseph Schumpeter, writing in 1949 on “modern stagnationism,” observed that “stagnationist moods had been voiced, at intervals, by many economists before.” Now they are being voiced again. They were always wrong before. Will they be right this time?
Among the factors we may speculate contribute to the markedly slower growth in real per capita GDP of this century are: the drag from financial crises and their resource misallocations; the aging of the population, with lower birth rates and long retirements; the fall in labor participation rates, so there are fewer producers as a percent of the population; the ever-more oppressive tangle of government regulations, so that “compliance” with the orders issued by bureaucrats becomes the top priority; and the massive monetary distortions of central banks, pretending to know what they are doing.
Can all this continue to suppress the underlying growth dynamic of scientific advance, innovation, entrepreneurship and enterprise of a market economy? Unless the government interventions get a lot worse (which they may!), I believe the current stagnationists will likely join their historical predecessors among the ranks of the false prophets. Let us hope so.
Japan versus the United States in per-capita GDP
Published by the R Street Institute.
We often see and hear in the media about the “stagnation” of economic growth in Japan. Let’s look at the numbers and see how Japan has done compared to the United States in the 15 years of the 21st century so far.
If we measure by growth in real gross domestic product (GDP), without considering changes in population, Japan’s economic growth is far behind that of the United States. From 2000 to 2015, its real GDP grew an average of 0.72 percent per year, while U.S. real GDP grew an average of 1.77 percent.
In average growth rates, more than 1 percent per year is a big difference, indeed, as it compounds over time. Over 15 years, this annual growth rate difference would add up to U.S. GDP being 30 percent larger, compared to 11 percent larger for Japan, a difference of 19 percentage points.
However, economic well-being is not measured by aggregate GDP, but by GDP per capita. The question is how much production there is per person. In this case, measuring per-capita growth gives us a very different outcome.
In 2015, Japan’s population was essentially the same as it was in 2000, with an average annual growth rate of 0.01 percent. The corresponding annual growth rate of the U.S. population was 0.87 percent. So the U.S. added 39 million more people over the period to provide for.
Thus real GDP growth per capita in Japan was 0.71 percent per year. In the United States, it was 0.89 percent – a much more similar number. The growth rate advantage over Japan, measured per capita, is reduced to a modest 0.18 percent.
If 0.71 percent growth is “stagnant,” what is 0.89 percent?